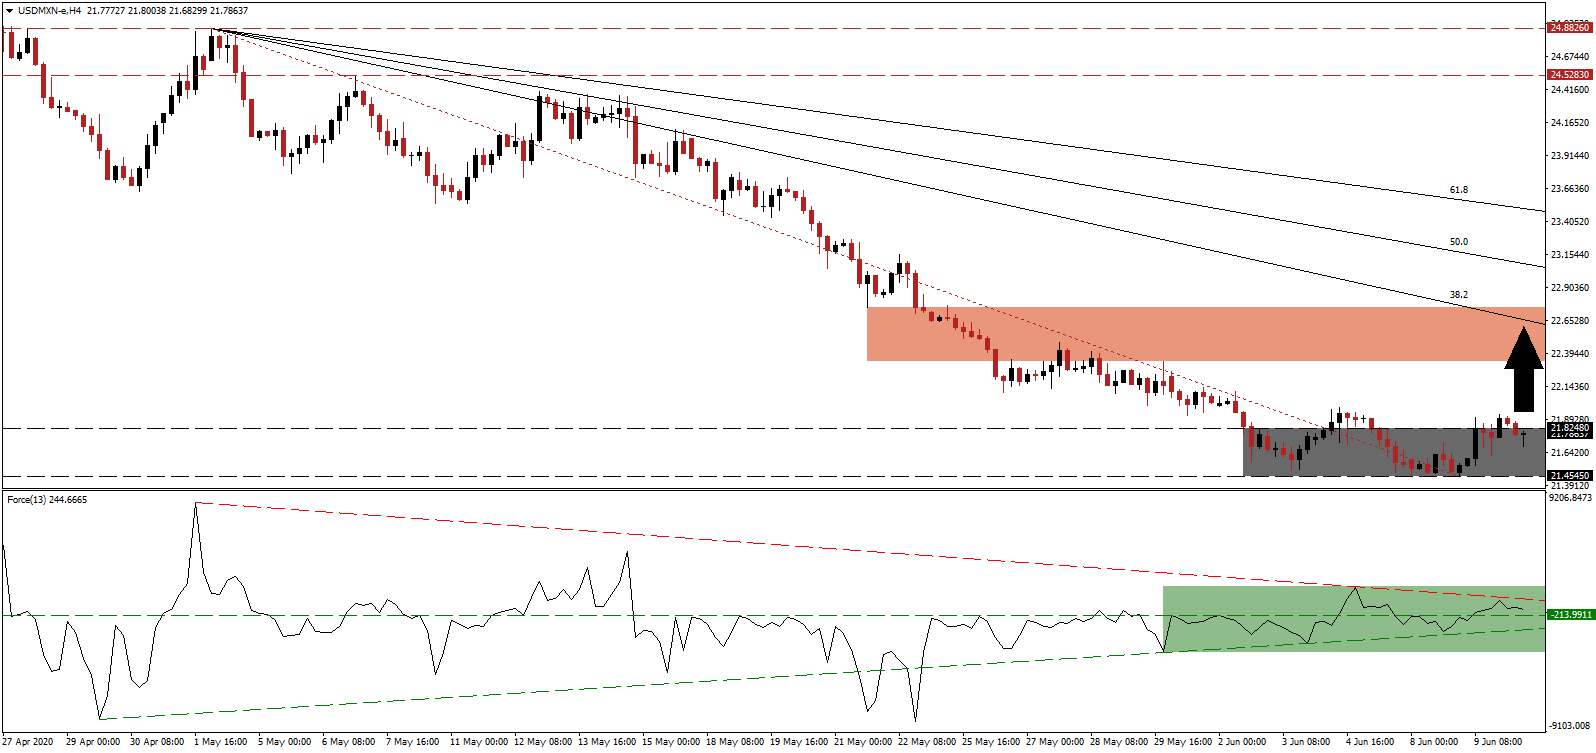
Mexico's Finance Minister Herrera announced the economy most likely plunged 17% in April and expects a marginally smaller drop for May. It follows the 1.2% GDP decrease reported for the first quarter, representing the fourth consecutive quarterly economic contraction. April is globally identified as the worst month for the negative fallout from the Covid-19 pandemic, but a surge in false optimism is leading to significant errors ranging from monetary policy to premature easing of lockdown restrictions. Disregard for safety instructions and social distancing is expanding globally, nurturing conditions for a more violent secondary wave of infections. The USD/MXN stabilized from its massive corrective phase after reaching its current support zone, followed by two failed breakout attempts.
The Force Index, a next-generation technical indicator, suggests a pending price action reversal through the emergence of a positive divergence. As this currency pair extended its correction, the Force Index advanced. The ascending support level supplied sufficient upside pressure to convert its horizontal resistance level into support. While the descending resistance level rejected an extension of the advance, as marked by the green rectangle, a brief spike cannot be excluded. Bulls are presently in control of the USD/MXN with this technical indicator in positive territory.
With estimates for Mexico’s economy to contract by as much as 10.0% in 2020, President López Obrador is lifting lockdown measures. Experts, including Dr. Moreno, the head of the Covid-19 unit at a top private hospital in Mexico, ABC Medical Center, caution against it. The pandemic is not under control. Cases surge across Latin America and notably fewer people adhere to safety measures. According to Dr. Moreno, whose hospital had to turn patients away despite doubling its capacity, it will result in more cases. Amid the rise in bullish momentum in the USD/MXN, a third breakout attempt above its support zone located between 21.4545 and 21.8248, as marked by the grey rectangle, is probable.
After President López Obrador confirmed the pandemic is under control in April, a New York Times analysis revealed the government provided incorrect data. The surge in new cases across Mexico confirmed the results. A rush to reopen economies is repeated across the globe, and the threat of a spike in new cases is more massive in the US. Riots and protests provided a breeding ground for the virus to spread swiftly, while the outcome of demonstrations is anticipated to scar the economy for years to come. Therefore, the upside potential for the USD/MXN is reduced to its downward revised short-term resistance zone located between 22.3351 and 22.7508, as identified by the red rectangle, enforced by the descending 38.2 Fibonacci Retracement Fan Resistance Level.
USD/MXN Technical Trading Set-Up - Temporary Breakout Scenario
Long Entry @ 21.7900
Take Profit @ 22.4500
Stop Loss @ 21.4500
Upside Potential: 6,600 pips
Downside Risk: 3,400 pips
Risk/Reward Ratio: 1.94
In the event the Force Index plunges below its ascending support level, the USD/MXN will extend its long-term corrective phase. It will delay a minor counter-trend advance, necessary to ensure the longevity of the bearish chart pattern. Forex traders are advised to consider any price spike from current levels as an outstanding selling opportunity, with negative progress out of the US adding a downside catalyst. Price action will challenge its next support zone between 19.8919 and 20.2760.
USD/MXN Technical Trading Set-Up - Breakdown Extension Scenario
Short Entry @ 21.1500
Take Profit @ 19.9000
Stop Loss @ 21.4500
Downside Potential: 12,500 pips
Upside Risk: 3,000 pips
Risk/Reward Ratio: 4.17

