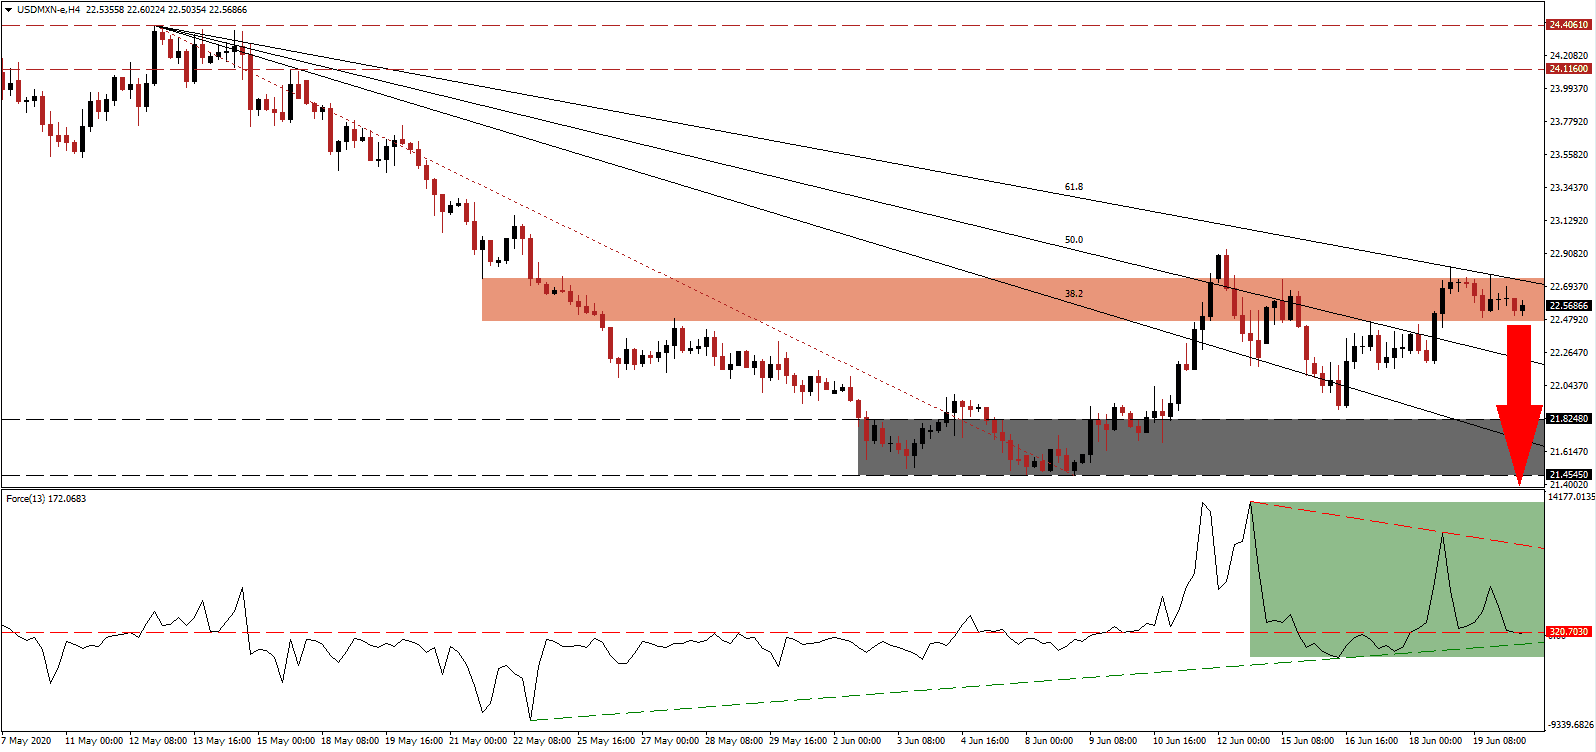
Global Covid-19 infections are surging to new daily records, led by the US. The worrisome increase emerged after governments, against the warnings of healthcare officials, rushed to reopen economies. Complete nationwide lockdowns were unsustainable and only intended to allow healthcare systems to prepare for a surge of patients. The rush to prematurely resume activities and limit essential restrictions rendered the previous efforts useless, and the result is an ongoing surge of infections, further reducing economic progress. Breakdown pressures in the USD/MXN are expanding inside the short-term resistance zone.
The Force Index, a next-generation technical indicator, confirmed the dominance of bearish pressures with a lower high, resulting in a redrawn descending resistance level. It is leading the conversion of the horizontal support level into resistance, as marked by the green rectangle. A collapse below the ascending support level is favored to guide this technical indicator below the 0 center-line, ceding control of the USD/MXN to bears.
With US initial jobless claims elevated, suggesting the May rebound cheered by financial markets was a temporary anomaly within a long and painful road to recovery, hopes now rest on US President Trump’s proposed $1 trillion infrastructure projects. It was rumored he preferred to push through a $2 trillion plan, but funding remains the primary obstacle. The US approach is copying that of socialist Mexican President López Obrador, who confirmed his mega projects are on track to add two million jobs by the end of 2020. After the USD/MXN recorded a lower high, a breakdown below the short-term resistance zone located between 22.4646 and 22.7508, as marked by the red rectangle, is anticipated.
Mexico refuses to follow in debt-funded bailouts of business, confirmed by stimulus measures totaling an estimated 0.7% of GDP. The US announced 12% worth of bailouts and assistance programs and is debating more debt. It remains unclear how this will impact President Trump’s request for $1 trillion to fund his infrastructure projects. Adding to breakdown pressures is the descending 61.8 Fibonacci Retracement Fan Resistance Level. The USD/MXN is well-positioned to correct into its support zone located between 21.4545 and 21.8248, as identified by the grey rectangle. An extension into its support zone between 19.8919 and 20.2760 is probably, due to the intensifying stress on the US Dollar.
USD/MXN Technical Trading Set-Up - Breakdown Scenario
Short Entry @ 22.5500
Take Profit @ 19.9000
Stop Loss @ 23.2000
Downside Potential: 26,500 pips
Upside Risk: 6,500 pips
Risk/Reward Ratio: 4.08
A breakout in the Force Index above its descending resistance level may inspire the USD/MXN to push higher. Mexico is set to become a primary beneficiary of pending supply-chain adjustments and nearshoring, adding a distinct bullish catalyst to the Mexican Peso. Any advance from current levels will offer Forex traders a secondary short-selling opportunity to consider. The upside potential is confined to its continuously downward revised resistance zone, presently located between 24.1160 and 24.4061.
USD/MXN Technical Trading Set-Up - Confined Breakout Scenario
Long Entry @ 23.5000
Take Profit @ 24.1000
Stop Loss @ 23.2000
Upside Potential: 6,000 pips
Downside Risk: 3,000 pips
Risk/Reward Ratio: 2.00

