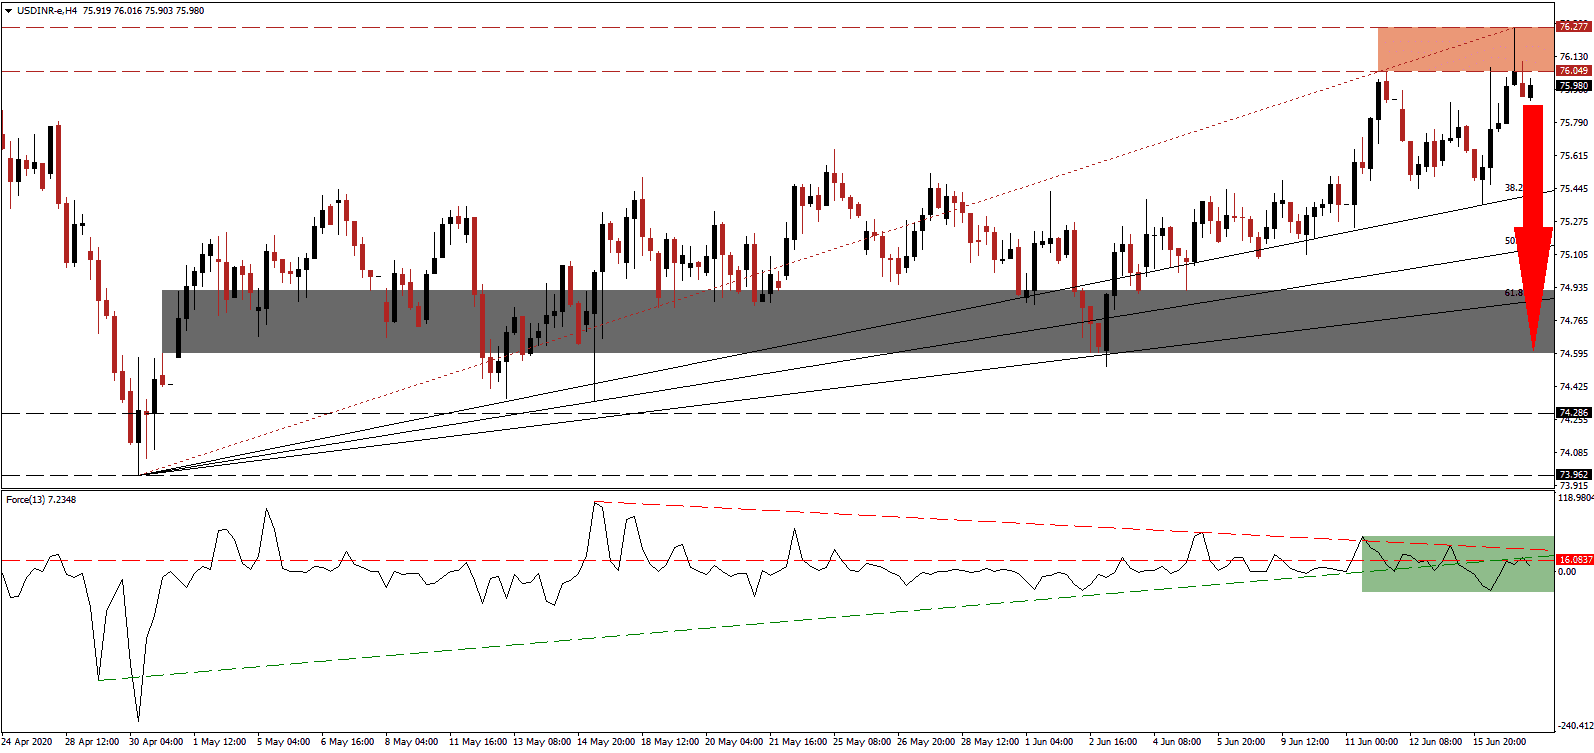
Yesterday’s retail sales recovery out of the US for May spiked the US Dollar temporarily. It did follow a record contraction in the previous month, with forwarding looking data and warnings from the US Federal Reserve and the International Monetary Fund depressing optimism quickly. Industrial and manufacturing production out of the US disappointed, while Chinese data came in weaker than expected, suggesting a long road to economic recovery lies ahead. The USD/INR briefly surged, resulting in a minor upward adjustment to the resistance zone, before a subsequent breakdown materialized.
The Force Index, a next-generation technical indicator, offers an early warning that a trend reversal is pending. While this currency pair drifted higher, the Force Index moved to the downside, and a negative divergence formed. The descending resistance level is adding to bearish pressures, and aided the conversion of the horizontal support level into resistance, as marked by the green rectangle. After the rejection in this technical indicator by its ascending support level, bears await a crossover below the 0 center-line to resume complete control of the USD/INR.
Indian exports for May nearly doubled as compared to April, from $10.36 billion to $19.05 billion, returning to its descending trendline. Imports rose from $17.12 billion to $22.20 billion, confirming the lack of domestic demand as India remains in nationwide lockdown. The trade deficit was narrower than forecast, due to the unexpected export recovery. With the US amid a new surge in infections, downside pressure on the US Dollar remains dominant. A profit-taking sell-off is favored to follow the breakdown in the USD/INR below its resistance zone located between 76.049 and 76.277, as marked by the red rectangle.
While the Covid-19 pandemic remains the primary challenge for India and the global economy, the Indian-Chinese border conflict cannot be ignored. Despite the commitment of the nuclear-armed neighbors to resolve it peacefully, a June 15th brawl at the Galwan River valley left twenty Indian troops dead with an unknown number of Chinese casualties. It is unlikely to deter the pending corrective phase in the USD/INR, anticipated to challenge its short-term support zone located between 74.595 and 74.919, as identified by the grey rectangle. A breakdown below the ascending 61.8 Fibonacci Retracement Fan Support Level cannot be excluded, which is likely to extend the sell-off.
USD/INR Technical Trading Set-Up - Profit-Taking Scenario
Short Entry @ 75.980
Take Profit @ 74.600
Stop Loss @ 76.300
Downside Potential: 13,800 pips
Upside Risk: 3,200 pips
Risk/Reward Ratio: 4.31
Should the Force Index accelerate above its descending resistance level, the USD/INR may attempt a second breakout. Improving Indian trade data and fiscal responsibility by the government of Prime Minister Modi maintain bearish pressures on price action. They are magnified by more debt and central bank interference out of the US. Therefore, Forex traders are advised to consider any price spike as an excellent selling opportunity. The next resistance zone is located between 76.433 and 76.769.
USD/INR Technical Trading Set-Up - Limited Breakout Scenario
Long Entry @ 76.450
Take Profit @ 76.750
Stop Loss @ 76.300
Upside Potential: 3,000 pips
Downside Risk: 1,500 pips
Risk/Reward Ratio: 2.00

