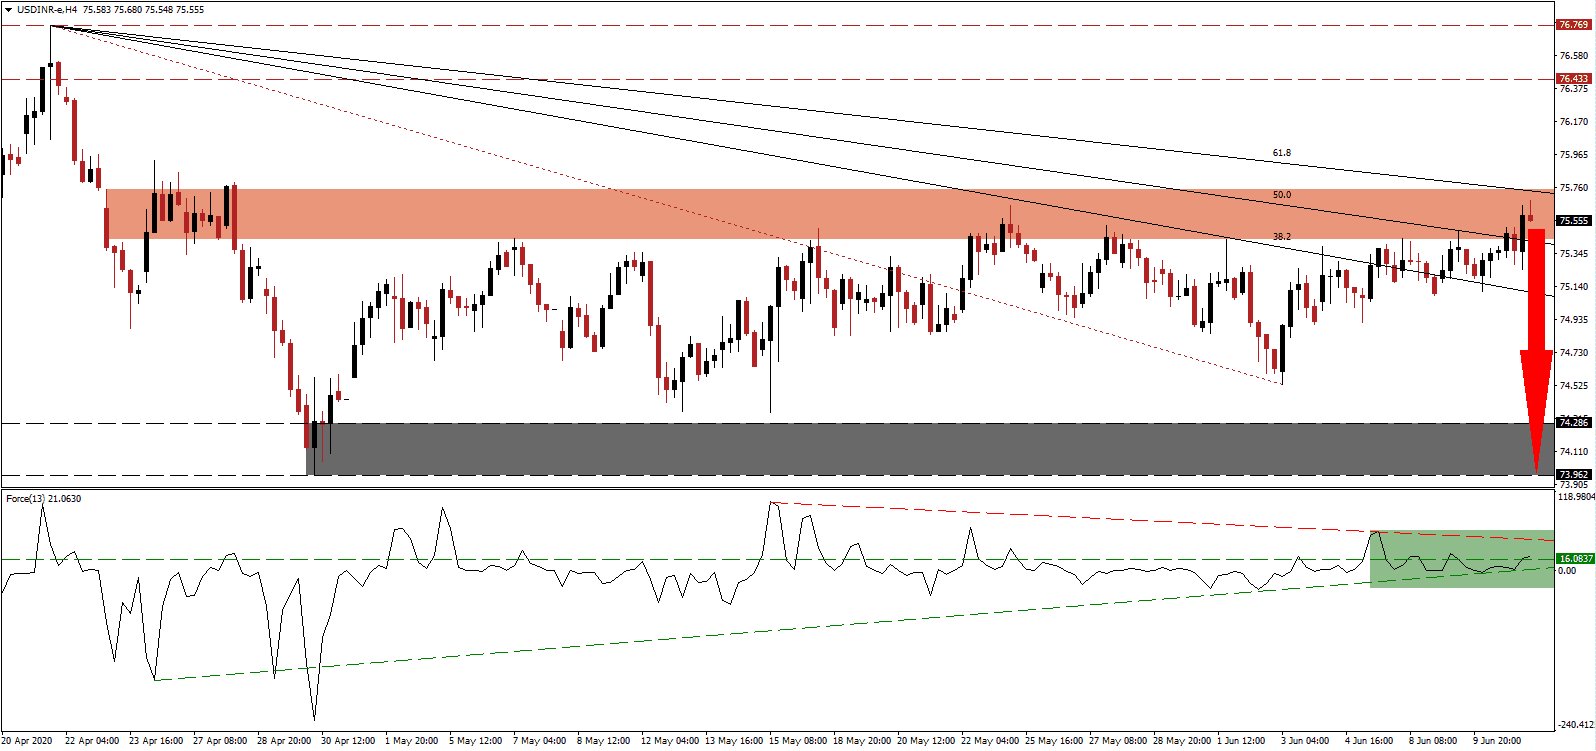
While the World Bank predicts a 3.2% GDP contraction for India’s fiscal year ending 2021, Fitch Ratings is looking ahead to a robust 9.5% recovery for 2022. It does forecast a 5.0% decrease for 2021. One positive outlined was the fiscal responsibility in the Covid-19 response. The announced ₹20 trillion spending package, approximately 10% of GDP, includes roughly 1% of capital injections. By comparison, the US is expanding to its unsustainable debt load, adding desired downside pressure in the US Dollar. The USD/INR was able to mount a short-term counter-trend advance, a necessary move to ensure the health of the long-term downtrend. It has now challenged the end-point of it, provided by the descending 61.8 Fibonacci Retracement Fan Resistance Level.
The Force Index, a next-generation technical indicator, points towards the absence of bullish pressures. It was able to eclipse its horizontal support level, as marked by the green rectangle, assisted by its ascending support level. It may attempt to spike into its descending resistance level but is unlikely to sustain any advance from present levels. Bears wait for a reversal in this technical indicator below the 0 center-line to regain control of the USD/INR.
India extended lockdown measures until the end of June, as new cases continue to rise. With the government of Prime Minister Modi focused on flattening the Covid-19 infection curve, Rajiv Baja, the managing director of Bajaj Auto, criticizes the approach. In his commentary with Congress leader Rahul Gandhi, he pointed out the government flattened the GDP curve, delivering the worst of both scenarios to India. Disagreements between business leaders and governments intensified across the world during the pandemic. The USD/INR is currently losing bullish momentum inside of its short-term resistance zone located between 75.433 and 75.746, as identified by the red rectangle.
Forex traders are recommended to monitor price action for a breakdown below the 50.0 Fibonacci Retracement Fan Support Level. It is likely to trigger a profit-taking sell-off, adding the necessary volume for an accelerated move to the downside. Yesterday’s commentary by US Federal Reserve Chairman Powell showed concern over the health of the economy, prompting the central bank to ensure financial markets that no interest rate increases are considered until 2023 at the earliest. It adds to bearish pressures on this currency pair, with the USD/INR poised to correct into its support zone located between 73.962 and 74.286, as marked by the grey rectangle. An extension of the breakdown sequence is probable.
USD/INR Technical Trading Set-Up - Breakdown Scenario
Short Entry @ 75.550
Take Profit @ 73.950
Stop Loss @ 75.950
Downside Potential: 16,000 pips
Upside Risk: 4,000 pips
Risk/Reward Ratio: 4.00
In case the Force Index moves above its descending resistance level, the USD/INR may be inspired into a breakout attempt. Due to a lack of US fiscal responsibility, short-term relief will lead to more long-term issues for the economy. Therefore, Forex traders are recommended to view any breakout attempt as a selling opportunity. The upside potential is limited to its resistance zone between 76.433 and 76.769.
USD/INR Technical Trading Set-Up - Limited Breakout Scenario
Long Entry @ 76.100
Take Profit @ 76.400
Stop Loss @ 75.950
Upside Potential: 3,000 pips
Downside Risk: 1,500 pips
Risk/Reward Ratio: 2.00

