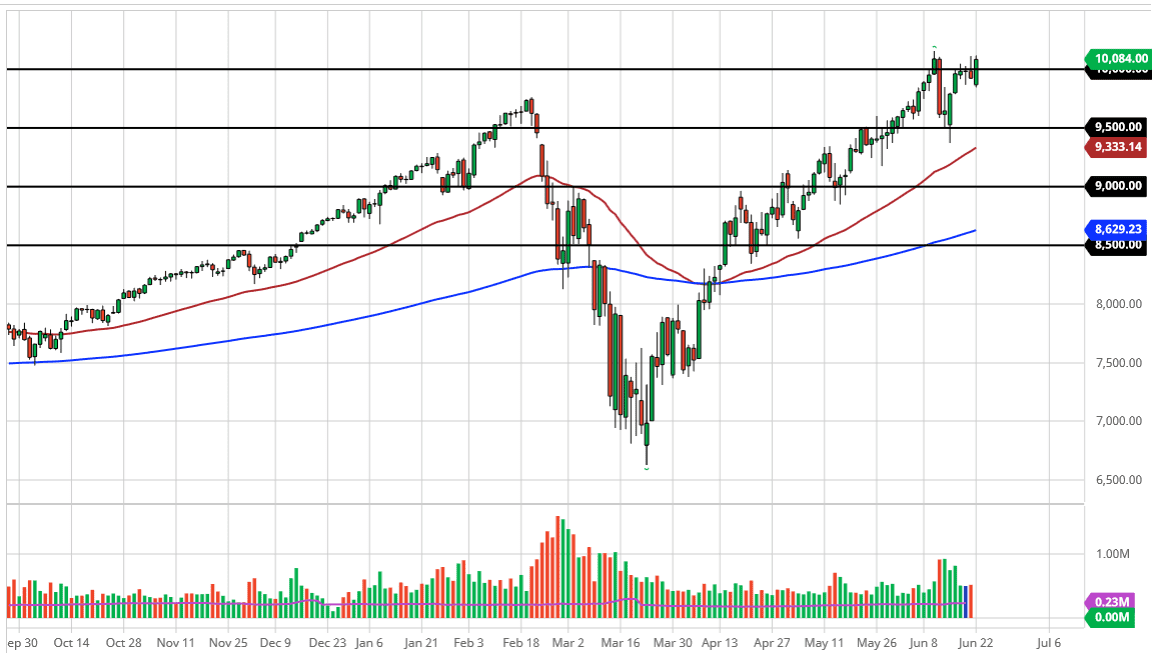
The S&P 500 has initially gapped lower during the trading session on Monday, but then turned around to not only fill that gap at continue going higher. Ultimately, this is a very bullish sign as we reached towards the 3100 level, an area that is important based upon the trading action from last week. It is an obvious area that there is plenty of supply and, so we could see a bit of a pullback. However, if we can break above the 3100 level on a sustained a move, we are likely to go looking towards the highs at the 3200 level again. Breaking above their opens up the door to the 3400 level but I think at this point we probably need some type of good news to make that happen.
Keep this in mind: The Federal Reserve is supporting this market and even though it has been bullish as of late, it seems to be flattening out a bit. That is not necessarily a good look, so I do not think we have anywhere to be right now. It would not surprise me at all to see this market dance around between the 50 day EMA just below the 3000 level, and the 3200 level above. If that is the case, we are simply looking at choppy back-and-forth range bound trading, and you can use this to levels as your potential boundaries to take advantage of that lack of momentum.
That being said, I am a bit more comfortable buying the S&P 500 right now that I am selling, perhaps just slightly so. I think we are one major news event away from moving in one direction or another, but right now whether or not that is negative or positive is essentially a “50-50 proposition.” Because of this, you need to be cautious to make sure you have your stop losses put in place, but with a reasonable sized position, you can get an opportunity to start trading back and forth, perhaps taking advantage of what should be choppy volatility. To the downside, if we were to break the 200 day EMA the 2800 level should be massive support. A break down below there would be extraordinarily negative. This is a market that I think continues to see more choppiness than anything else so therefore you need to be overly cautious.