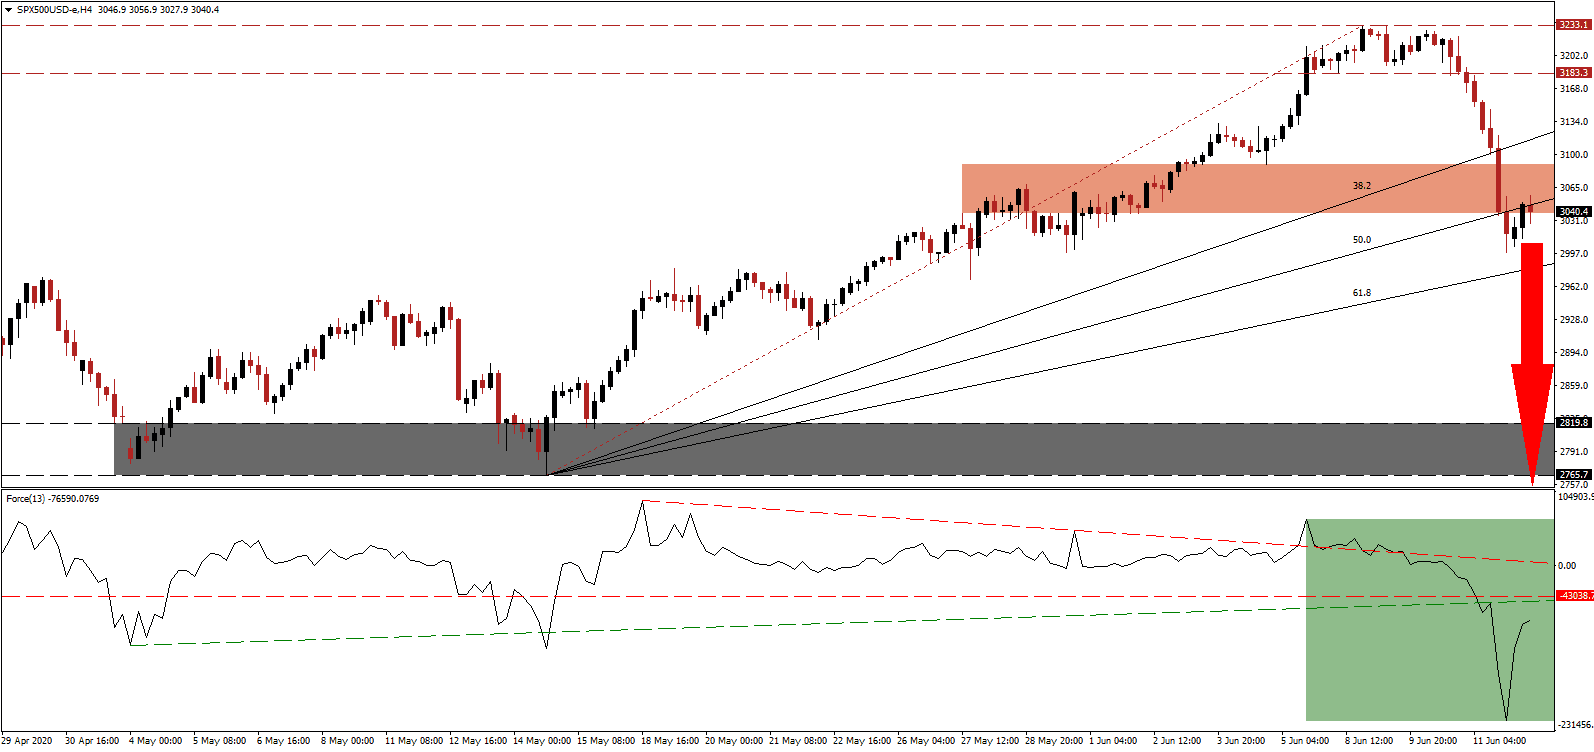
After US Federal Reserve Chairman Powell delivered a pessimistic outlook on the economic recovery potential, equity markets delivered the worst single-day drop since mid-March. Today’s trading session could manifest the gravest weekly contraction since the week ending March 20th, when indexes plunged by 12%. Retail traders got sucked into a vortex fueled by misguided hopes, as states rushed to reopen economies despite the Covid-19 pandemic expanding. New cases have soared across the world, and US states leading the easing of restrictions are now at the forefront of record infections. The S&P 500, following the creation of a significantly lower high, completed a breakdown below its resistance zone.
The Force Index, a next-generation technical indicator, confirmed the end of the rally with a collapse to a new multi-month low. It has since recovered aggressively but remains below its ascending support level and its horizontal resistance level, as marked by the green rectangle. Adding to downside pressures is the descending resistance level, while bears remain in complete control of the S&P 500 with this technical indicator below the 0 center-line.
New apartment leases in Manhattan contracted by 62% in May, and inventory surged by 34%. Nashville is delaying the next phase of the reopening process, Arizona, California, and Texas witness a surge in new COVID-19 infections since Memorial Day. The list of negative economic progress in the US is ongoing, ignored by retail traders who flocked to bankrupt companies and penny stocks, confirming a new bubble. The S&P 500 is presently challenging its ascending 50.0 Fibonacci Retracement Fan Resistance Level inside of its short-term resistance zone located between 3,038.6 and 3,089.6, as marked by the red rectangle.
US Treasury Secretary Mnuchin confirmed that a new nationwide lockdown cannot be implemented. A new round of stimuli, including a second direct payment to consumers, is being debated. The current trajectory by the US, on a state and federal level, places the healthcare system under unsustainable stress. Despite the absence of a nationwide lockdown, the economy will suffer from a lack of activity until a cure for the virus is readily available on a global level. The S&P 500 is on course for a breakdown extension into its support zone located between 2,765.7 and 2,818.8, as identified by the grey rectangle. More downside is probable as the pandemic gathers momentum.
S&P 500 Technical Trading Set-Up - Breakdown Extension Scenario
Short Entry @ 3,040.0
Take Profit @ 2,765.0
Stop Loss @ 3,130.0
Downside Potential: 2,750 pips
Upside Risk: 900 pips
Risk/Reward Ratio: 3.06
A breakout in the Force Index above its ascending support level could lead to more upside in the S&P 500. It will provide traders with an excellent secondary selling opportunity, as the outlook for the global economy is increasingly bearish. The second-quarter earnings season could collapse this index to 2020 lows and beyond unless fundamental circumstances improve rapidly. The upside potential is confined to its long-term resistance zone.
S&P 500 Technical Trading Set-Up - Limited Breakout Scenario
Long Entry @ 3,165.0
Take Profit @ 3,230.0
Stop Loss @ 3,130.0
Upside Potential: 650 pips
Downside Risk: 350 pips
Risk/Reward Ratio: 1.86

