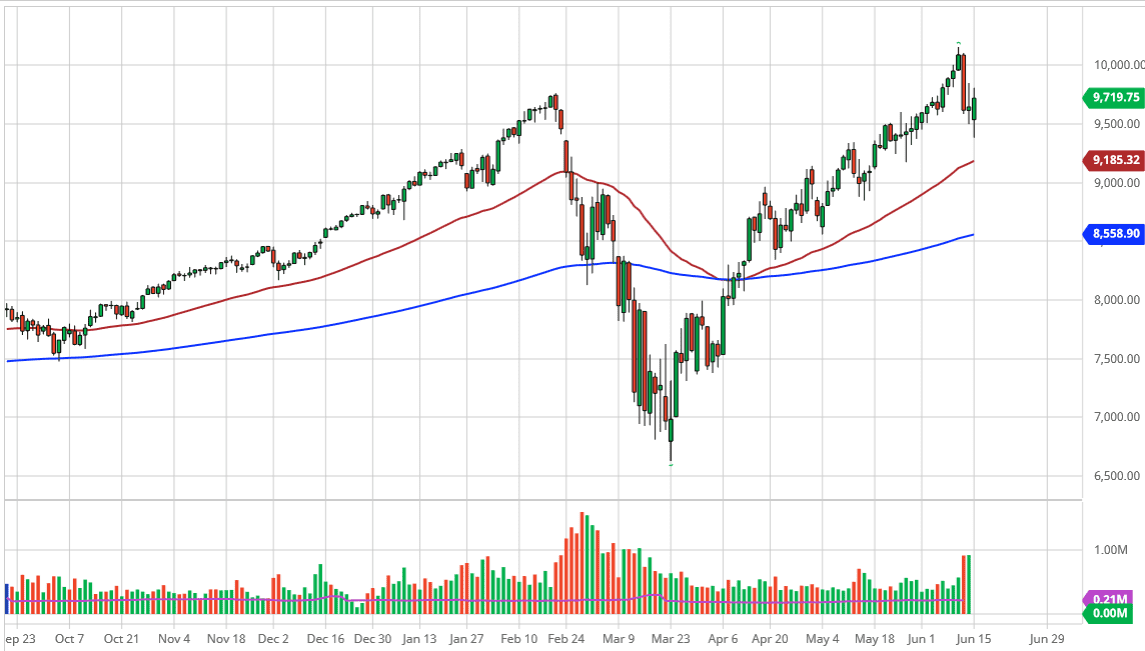
The NASDAQ 100 has broken down significantly initially to kick off the trading week, but then turned around quite massively as the Federal Reserve has failed to keep the markets going higher no matter what. Obviously, that is not actually what they said but what they did do was talk about buying individual corporate bonds, something that is not even legal from everything that I am reading. Nonetheless, the idea that they are willing to step in and bail out specific companies in a bit of a portfolio, especially with those who employ a lot of people, essentially continues to put upward pressure on a market that is probably somewhat artificially lifted at the moment.
The market broke down below the 9500 level but did find buyers which makes sense anyways because there was a gap there previously, and then of course the 50 day EMA underneath offers plenty of support. The 50 day EMA is a major indicator that a lot of people will pay attention to, deciding whether or not the market is in an uptrend or not. As long as we are above there, we are not only in an uptrend, but we are in a relatively quick moving uptrend. Furthermore, the market looks as if it is in a bit of a nice channel that is granting higher at a 45° angle, which is almost a perfect uptrend.
Now that the Federal Reserve has stepped in and started talking about buying these bonds, this continues to find traders looking for some type of risk appetite to step into. The 10,000 level of course is significant, as it was the scene of a major breakdown so therefore, I think it continues to be a bit of a short-term ceiling. All things being equal, the market is likely going to struggle to break down significantly, because there is so much in the way of choppiness underneath. That normally means that there is a lot of order flow, and that of course normally slows down movement in one direction or another. The 200 day EMA would be the next target after the 50 day EMA, which of course also opens up the possibility of 9000 offering support. If we can break to a fresh, new high, then it is likely that the market simply grinds to the upside. I do not necessarily like shorting this market, and I think that short-term pullbacks are looking for buyers to come in and pick up value.