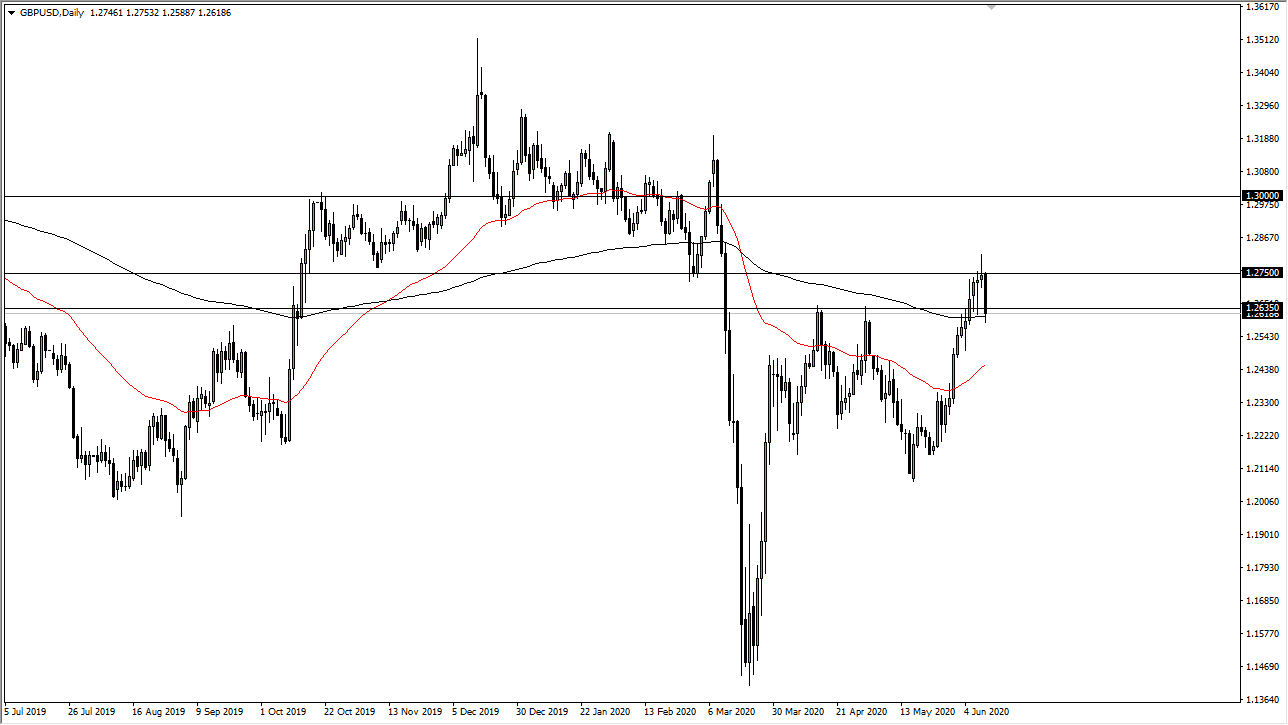
The British pound has broken down significantly during the trading session on Thursday, slicing through the 200 day EMA. While this is a negative sign, there is a lot of support just below so I wonder whether or not we can continue to go much further to the downside? If we do break down below the large, round, psychologically important 1.25 handle, then it is likely that we will then go to the 1.22 handle.
On the upside, the 1.2750 level will offer a bit of resistance, as we have seen the shooting star formed after the Federal Reserve meeting. When the US dollar started to strengthen after the Federal Reserve meeting, it confirmed that the Federal Reserve was going to keep monetary policy easy, and that was a sign that something was not quite right with the British pound. The question now is whether or not the market has broken out and then pulled back to find support, or if it is going to break down. I suspect that there is enough support just below to keep this market somewhat afloat but again if we were to blow through the 1.25 handle, which could be rather negative.
If we were to break above the 1.275 level and close above there on a daily close, that would be a very bullish sign and send this market looking towards the 1.30 level. That of course is a large, round, psychologically significant figure as well, so I would anticipate a bit of resistance in that area.
Looking at this chart, we are most certainly in an area of inflection, so it does make sense that we are about to make a big picture. Because of this, I would be cautious but will be looking for the next impulsive candlestick to put money to work. The trading session on Thursday was extremely negative, but at the end of the day it was not enough to change the overall trend. The 200 day EMA being in the same area also is something worth paying attention to, so I think a lot of long-term traders are starting to look at this with great interest. After all, when we broke above the 200 day EMA, it was a very bullish technical signal. I do not know that the market is quite ready to give up that idea quite yet. Friday will end up being very crucial.