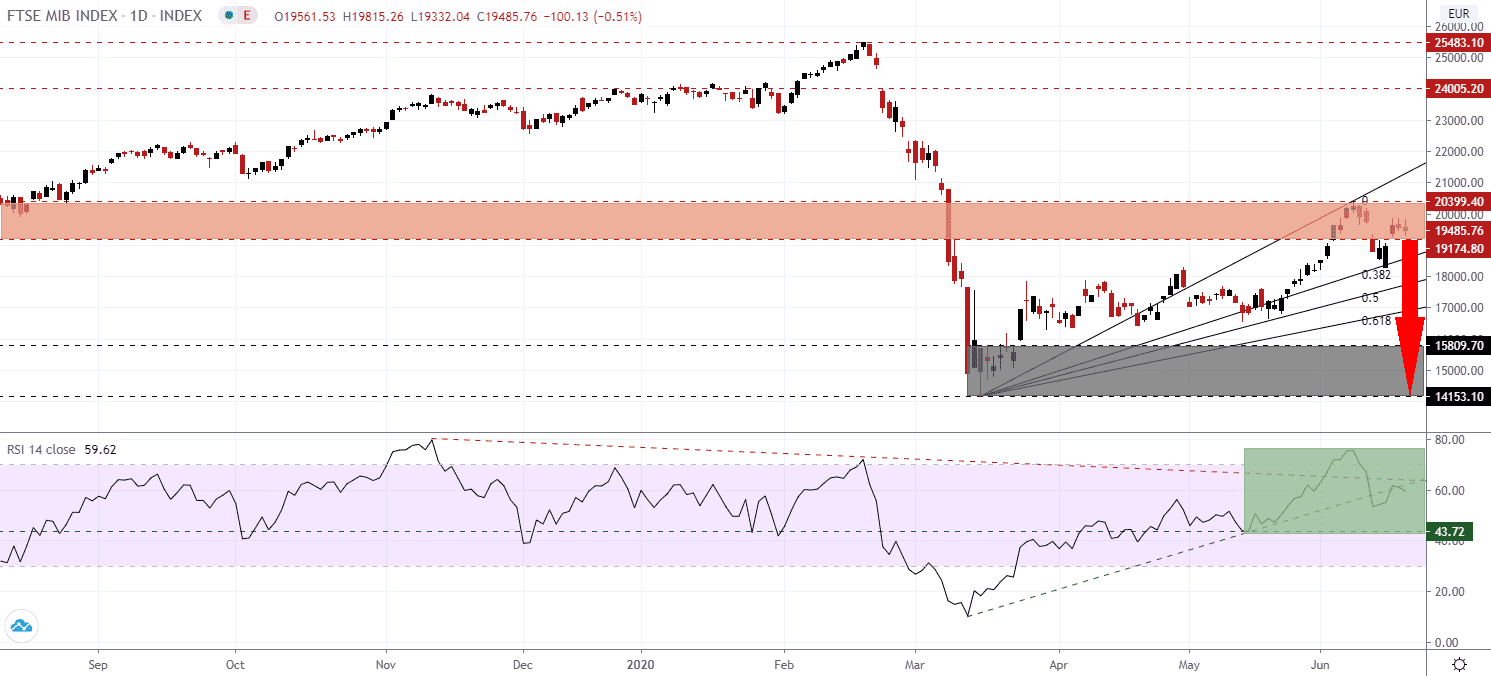
Roberto Gualtieri, the Italian Minister of Economy and Finance, acknowledged that the economy will exceed the 8.0% contraction for 2020 presently forecast. The primary reason was a prolonged disruption in the tourism sector. The Bank of Italy predicts a 9.2% drop in GDP while the European Commission one of 9.5%. Italy has long struggled with economic weakness, never fully recovering from the 2008 global financial crisis and the 2015 Eurozone debt crisis. With an estimated 2020 debt-to-GDP ratio of 155.7% and continuous disagreements with the EU regarding its budget, tensions between Rome and Brussels have remained elevated. The FTSE MIB recovered from a breakdown below its short-term resistance zone but recorded a lower high.
The Relative Strength Index, a widely used technical indicator to identify overbought and oversold conditions, briefly spiked into extreme overbought territory above 80.0 before retreating. Adding to bearish developments was the slide below its ascending support level, as marked by the green rectangle. The descending resistance level is increasing downside pressure and favored to force it below its horizontal support level, leading the FTSE MIB into a more massive corrective phase.
While Italian Prime Minister Conte was able to strengthen his leadership at the peak of the Covid-19 pandemic in Italy, faced with one of the highest mortality rates from the virus globally, the economic crisis is posing a new threat for him to address. Under his direction, Italy imposed a nationwide lockdown, which was seen as a global experiment and repeated across the world, while the budget deficit is on track to reach 10.4% of GDP in 2020. The FTSE MIB is well-positioned for a second breakdown below its short-term resistance zone located between 19,174.8 and 20,399.40, as marked by the red rectangle.
With his popularity surging, rumors emerged that he may find his party. He has an unstable alliance formed between Five Star and the Democratic Party, to prevent the League from gaining the office of Prime Minister. Polls suggest 15% of support should be moved ahead. It will fraction the Italian political landscape further and has angered the two parties who installed him as Prime Minister, understanding they created a competitor. The FTSE MIB is on course to move below its 38.2 Fibonacci Retracement Fan Support Level, from where an accelerated sell-off into its support zone located between 14,153.1 and 15,809.7, as identified by the grey rectangle, is probable.
FTSE MIB Technical Trading Set-Up - Breakdown Scenario
Short Entry @ 19,485.0
Take Profit @ 14,155.0
Stop Loss @ 20,500.0
Downside Potential: 53,300 pips
Upside Risk: 10,150 pips
Risk/Reward Ratio: 5.25
Should the RSI reverse from its most recent dip below 60.0 and move above its descending resistance level, the FTSE MIB may attempt a breakout. Given the near-overbought conditions of this index, in conjunction with political uncertainty out of Italy and rising Covid-19 infections, any price spike will offer traders a secondary short-selling opportunity. The next resistance zone is located between 24,005.2and 25,483.1.
FTSE MIB Technical Trading Set-Up - Limited Breakout Scenario
Long Entry @ 21.500.0
Take Profit @ 24,000.0
Stop Loss @ 20,500.0
Upside Potential: 25,000 pips
Downside Risk: 10,000 pips
Risk/Reward Ratio: 2.50

