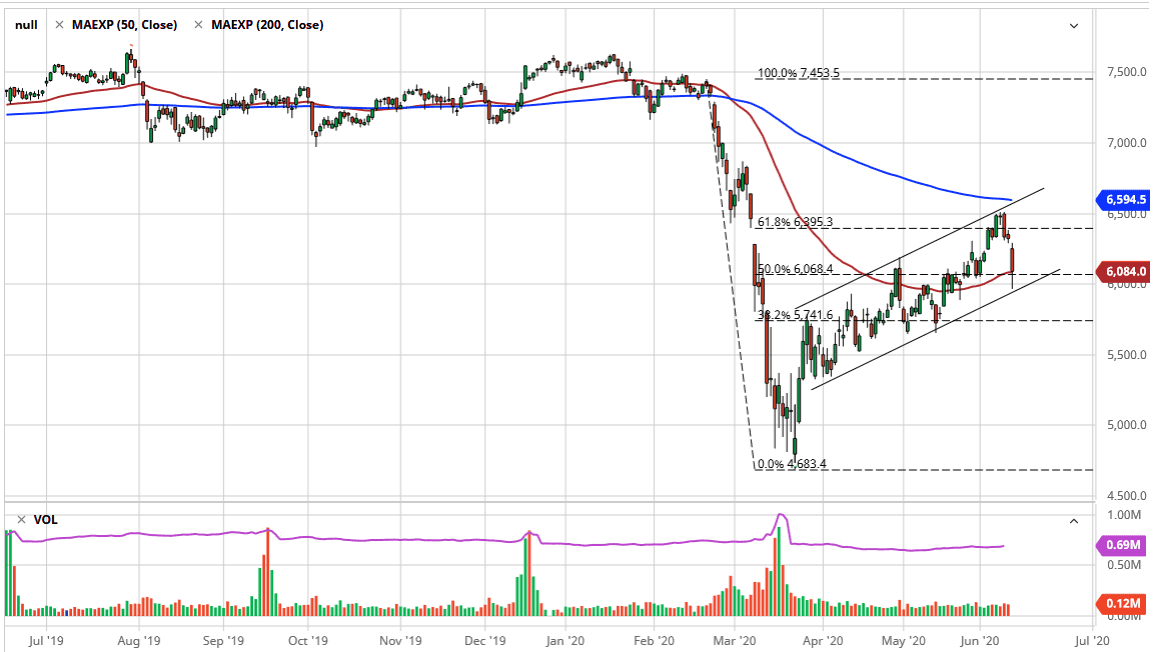
The FTSE 100 got absolutely crushed during the trading session on Thursday, slicing through the 50 day EMA. This of course was a very negative sign and stocks around the world got sold off indiscriminately as traders are starting to worry about the possibility of coronavirus having a larger infection rate again, and what could be thought of as the “second wave of coronavirus” coming down the road. That being said, it was more or less an excuse for traders to take some profits after buying at extreme lows.
What is worth noting is that on Tuesday, the market rolled back from the 6500 level, which has the 200 day EMA just above. At this point, the market has shown itself to continue in a major channel as marked on the chart, with the 6000 level being important and showing that there is plenty of buying pressure in that area again. Furthermore, there is an uptrend line from the bottom part of that channel, so at this point it makes sense that there was a bit of a bounce later in the day. The 50 day EMA is sitting just below where the market closed, so it makes sense that the market would continue to pay attention to it.
I believe that we would more than likely continue the overall channel, reaching towards the 6500 level. Having said that, if the market was to break down below the bottom of the candlestick and of course the channel, then the market is likely to go looking towards the 5750 handle, and then possibly the 5500 level. Ultimately, this is a market that I think continues to look at the overall picture, so until we get a bit more clarity on the global growth picture, I believe that the “pain trade” is still to the upside. The most important technical indicator on the chart right now for me though is going to be that channel, so I have to assume that the market is simply going to stay within this channel, so although I am not overly bullish, I would have to assume that there is a bounce in this market still. However, if we break down then you will see a breakdown not only here, but probably in other indices around the world as well. After all, they are all starting to move in the same direction at the same time.