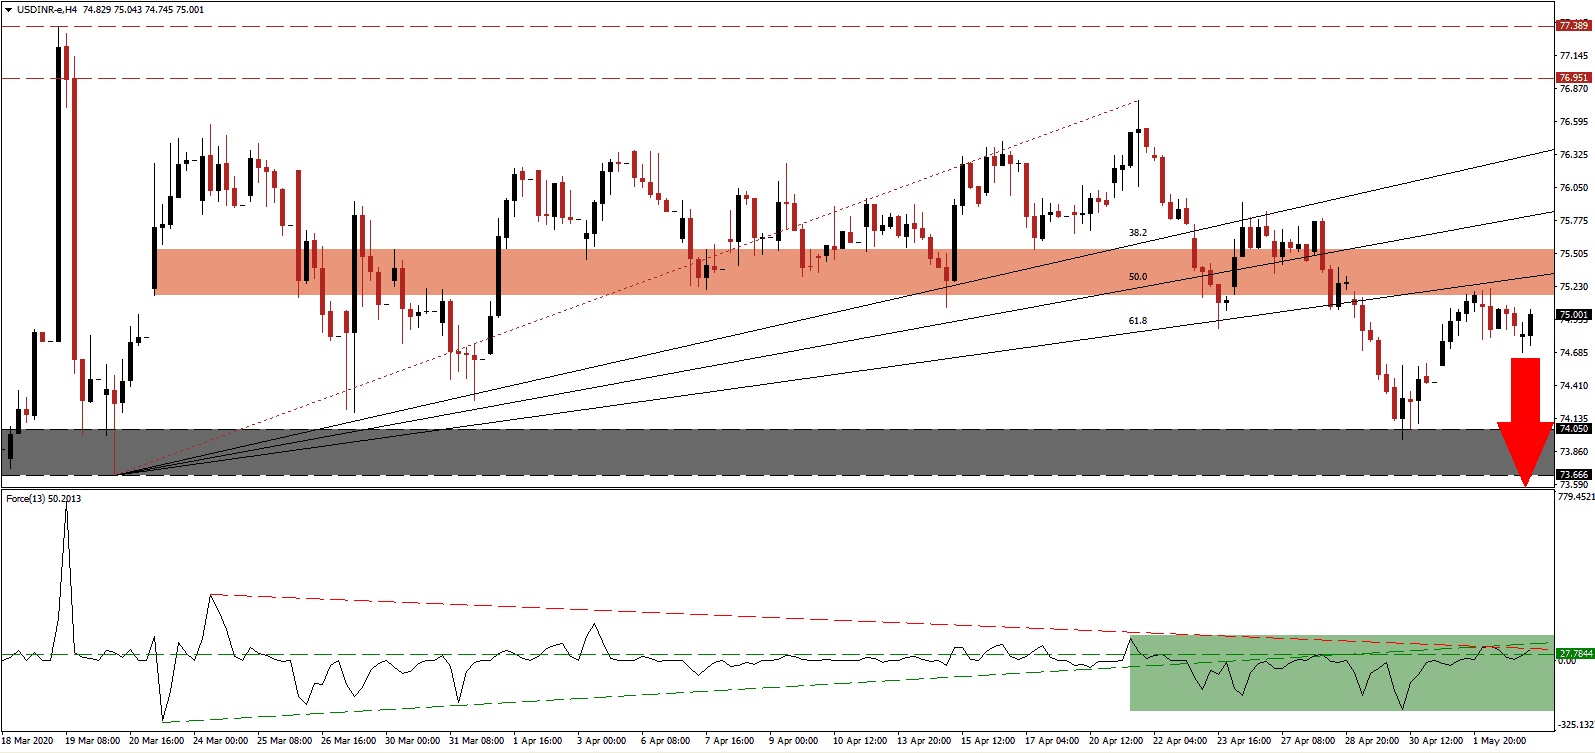
India divided its country into three zones. Green is where social life and economic activity face the least disruptions, but travel is restricted. It is followed by the orange, where more severe lockdown measures are in place, succeeded by red. With restrictions being eased, India’s economy may not benefit significantly as major industrial hubs like Delhi, Mumbai, Ahmedabad, and Pune remain in the red zone. Covid-19 infections continue to increase, and calls for more government assistance are on the rise. The USD/INR bounced off of the top range of its support zone before stalling at a twin resistance level. A new breakdown sequence is pending on the back of a much weaker US economy.
The Force Index, a next-generation technical indicator, was able to push above its horizontal resistance level, changing it into support, but is faced with its descending resistance level favored to pressure it into a reversal. The Force Index also remains below its ascending support level, adding to bearish conditions in the USD/INR. This technical indicator is expected to revert into negative territory, granting control of price action to bears.
After the USD/INR was rejected by its ascending 61.8 Fibonacci Retracement Fan Resistance Level inside of its short-term resistance zone located between 75.154 and 75.541, as marked by the red rectangle, the bearish chart pattern was confirmed. Concerns over debt servicing capabilities of the corporate and micro, small, and medium enterprises (MSMEs) remain a primary issue together with labor shortages, with transportation halted. The Indian government announced a cap on stimulus spending at 4.5 trillion Rupees, as it attempts to ensure the stability of its long-term financial outlook. By contrast, the US is adding to its unsustainable debt load in an uncontrolled manner.
Today’s US Non-Manufacturing PMI could provide the next short-term fundamental catalyst to force the USD/INR into its support zone located between 73.666 and 74.050, as identified by the grey rectangle. India’s concern over fiscal sustainability adds a bullish catalyst to the Indian Rupee, as financial markets will shift their focus to the cost of lockdowns, stimuli, and bailouts. A more realistic outlook on the economic recovery prospects is paramount, where India is ahead of the US. A breakdown extension into the next support zone between 72.348 and 72.702 should be considered.
USD/INR Technical Trading Set-Up - Breakdown Extension Scenario
Short Entry @ 75.000
Take Profit @ 72.350
Stop Loss @ 75.850
Downside Potential: 26,500 pips
Upside Risk: 8,500 pips
Risk/Reward Ratio: 3.12
A sustained breakout in the Force Index above its ascending support level, acting as present resistance, can inspire the USD/INR to attempt a breakout. The next resistance zone is created by the 38.2 Fibonacci Retracement Fan Resistance Level and the intra-day high of 76.769, the end-point of its Fibonacci Retracement Fan sequence. Forex traders are advised to use any push into this zone should as an opportunity to take new net short positions, with the long-term outlook carrying a distinct bearish bias.
USD/INR Technical Trading Set-Up - Limited Breakout Scenario
Long Entry @ 76.150
Take Profit @ 76.750
Stop Loss @ 75.850
Upside Potential: 6,000 pips
Downside Risk: 3,000 pips
Risk/Reward Ratio: 2.20

