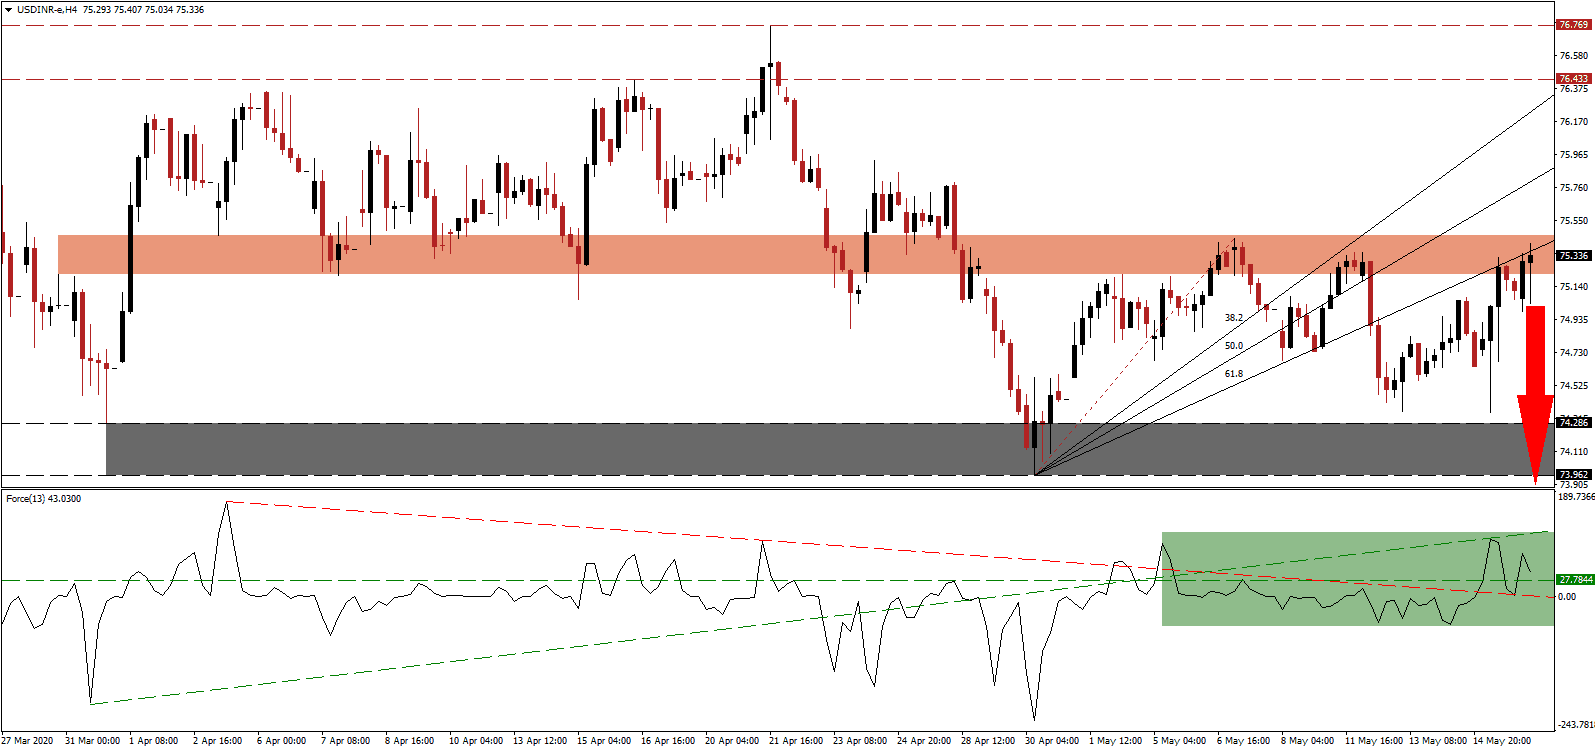
India is faced with a $1 trillion opportunity loss due to the Covid-19 pandemic and government response to it. GDP estimates call for a contraction of up to 10.8% with 135 million job losses and 120 million reverting to poverty. It poses a tremendous challenge for Prime Minister Modi and his vision to increase economic output by $5 trillion, setting his country on a path of self-reliance. The ₹20 trillion spending package is hoped to provide the necessary support mechanism to kickstart Asia’s third-largest economy. Volatility in the USD/INR increased, with price action spiking into its short-term resistance zone where it faces rejection by its ascending 61.8 Fibonacci Retracement Fan Resistance Level.
The Force Index, a next-generation technical indicator, pushed through its descending resistance level and converted its horizontal resistance level into support, as marked by the green rectangle. It was rejected by its ascending support level from where it is well-positioned to retrace its most recent advance. A collapse in this technical indicator into negative territory will allow bears to regain full control of the USD/INR, leading to more selling pressure. You can learn more about the Force Index here.
How well India can protect its micro, small and medium enterprises will fulfill a defining role in plans to rebuilt a more substantial and inclusive economy. Migrant workers are presently left vulnerable as they reside in different states for employment reasons than where they are registered. It excludes them from assistance and exposes critical structural flaws in the system, which could be forced into positive changes due to the virus. Uncertainty remains, but the long-term outlook is cautiously bullish. With the USD/INR rejected inside of its short-term resistance zone located between 75.214 and 75.457, as marked by the red rectangle, the next wave of selling pressure is accumulating.
Adding to long-term bearish developments is the excessive increase in US debt to fund economic stimuli and corporate bailouts. While India is committed to addressing painful structural reform, the US remains complacent over the necessity to adapt to a change in consumer behavior sparked by the global Covid-19 pandemic. It positions the USD/INR to collapse into its support zone located between 73.962 and 74.286, as identified by the grey rectangle. An extension of the breakdown into the next support zone between 72.348 and 72.702 is probable, backed by further deterioration in the US Dollar, together with a bearish long-term outlook.
USD/INR Technical Trading Set-Up - Breakdown Extension Scenario
Short Entry @ 75.350
Take Profit @ 72.350
Stop Loss @ 75.950
Downside Potential: 30,000 pips
Upside Risk: 6,000 pips
Risk/Reward Ratio: 5.00
Should the Force Index reclaim its ascending support level, the USD/INR could attempt a breakout. With US economic reports printing a more severe recession than economists hoped for, coupled with an addiction to government assistance since the 2008 global financial crisis, any advance should be viewed by Forex traders as a secondary selling opportunity. The upside potential is reduced to its resistance zone between 76.433 and 76.769.
USD/INR Technical Trading Set-Up - Limited Breakout Scenario
Long Entry @ 76.150
Take Profit @ 76.550
Stop Loss @ 75.950
Upside Potential: 4,000 pips
Downside Risk: 2,000 pips
Risk/Reward Ratio: 2.00

