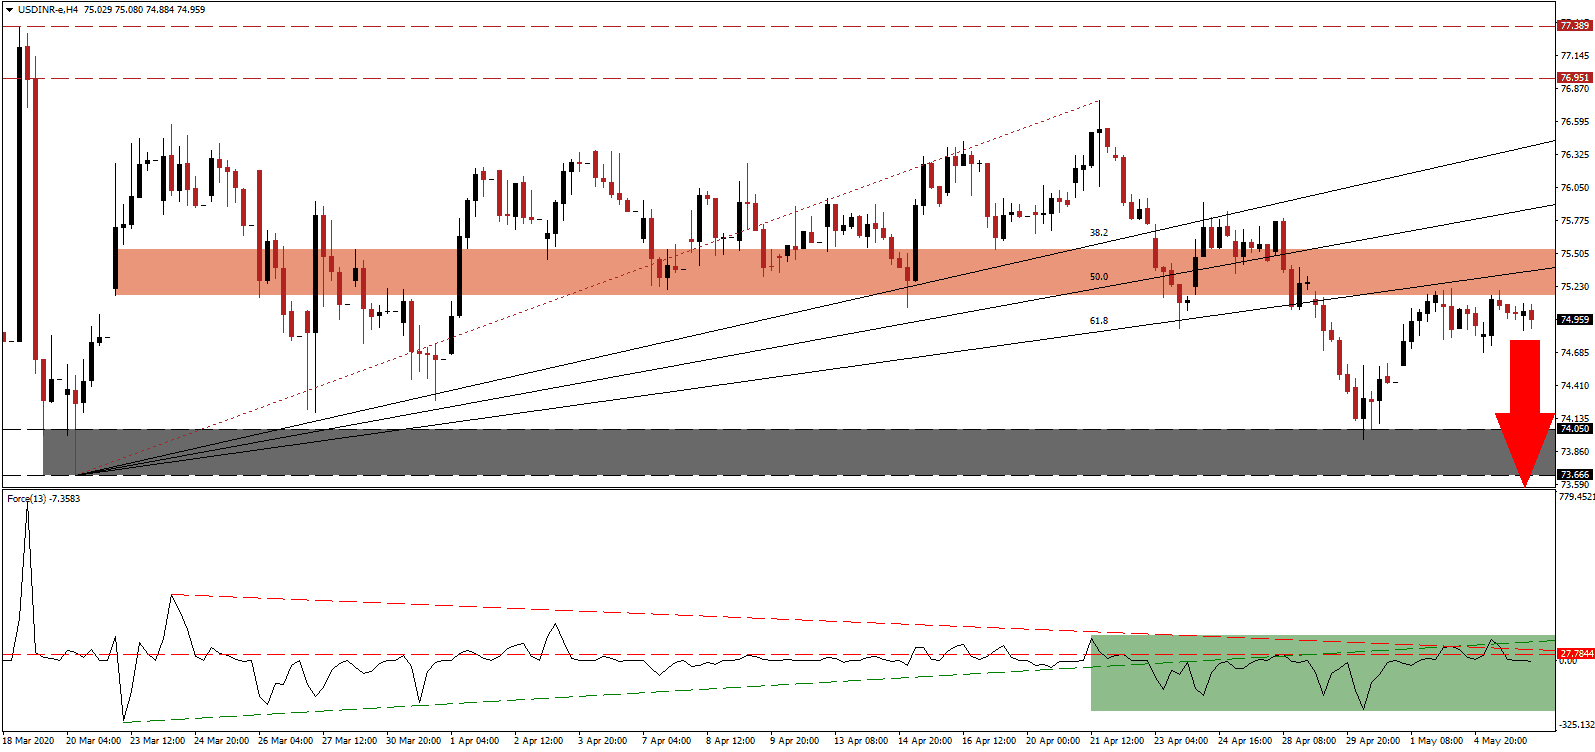
Despite this morning dismal Indian services PMI report for April, showing the sector in deep depressive conditions, the Indian Rupee remained resilient. All economic contributors are faced with a similarly negative circumstance except for agriculture, which is estimated to grow by 3.0%. India used to be an agricultural nation until the 1991 balance of payments crisis. It ushered in an era known as LPG, acronymous for liberalization, privatization, and globalization. The transition placed the service sector at the core of the economy, which now suffers the most from implemented lockdown measures. The USD/INR maintains its position below the short-term resistance zone, with accumulation in bearish momentum likely to result in more selling.
The Force Index, a next-generation technical indicator, briefly pierced its ascending support level to the upside before completing a triple breakdown. After contracting below its descending resistance level, the Force Index converted its horizontal support level into resistance, as marked by the green rectangle. Adding to bearish developments is the slide in this technical indicator below the 0 center-line, ceding control of the USD/INR to bears. You can learn more about the Force Index here.
Calls for irresponsible fiscal spending are growing, risking a duplication of fundamental errors implemented by developed economies since the 2008 global financial crisis. As long as the Modi government resists a short-term approach to a long-term problem, the economy has a future for sustained recovery. GDP is forecast to drop by as much as 15%, but if essential adjustments are implemented, a progressive reconstruction will lead to a more powerful marketplace. It will additionally support a broader segment of the population. The USD/INR remains below its short-term resistance zone located between 75.154 and 75.541, as marked by the red rectangle, from where breakdown pressures are building.
One essential level to monitor is the intra-day low of 74.681, the base of the rejection in price action by its ascending 61.8 Fibonacci Retracement Fan Resistance Level. A breakdown is anticipated to generate volume for this currency pair to accelerate into its support zone located between 73.666 and 74.050, as identified by the grey rectangle. Forex traders await today’s US ADP report for March, where over 20 million job losses are expected. It may provide another bearish catalyst for the USD/INR, which is positioned to extend its breakdown sequence into its next support zone between 72.348 and 72.702.
USD/INR Technical Trading Set-Up - Breakdown Extension Scenario
Short Entry @ 75.000
Take Profit @ 72.350
Stop Loss @ 75.850
Downside Potential: 26,500 pips
Upside Risk: 8,500 pips
Risk/Reward Ratio: 3.12
In the event the Force Index spikes above its ascending support level, the USD/INR could attempt a temporary breakout. Due to persistent US weakness and uncontrolled spending, with the US Treasury set to borrow $3 trillion in the second quarter, the outlook for this currency pair is increasingly bullish. The next resistance zone is located between the 38.2 Fibonacci Retracement Fan Resistance Level and the intra-day high of 76.769, the end-point of its Fibonacci Retracement Fan sequence. Forex traders are advised to consider this an exceptional opportunity for subsequent sell orders.
USD/INR Technical Trading Set-Up - Limited Breakout Scenario
Long Entry @ 76.150
Take Profit @ 76.750
Stop Loss @ 75.850
Upside Potential: 6,000 pips
Downside Risk: 3,000 pips
Risk/Reward Ratio: 2.20

