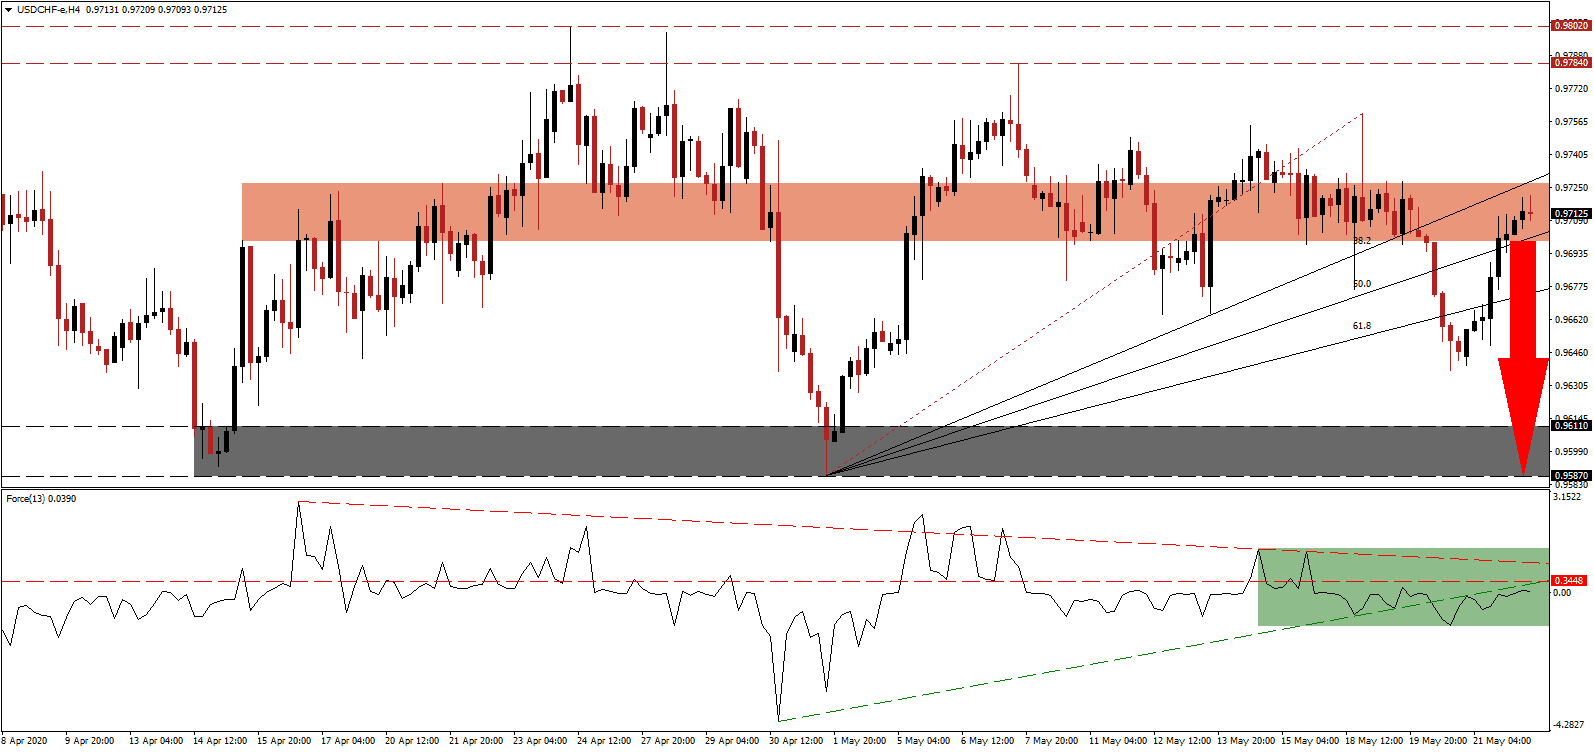
US economic data supports a more severe economic disruption than previously forecast. Initial jobless claims are slowing, but at this pace will remain an essential drag on GDP for an extended period. Adding to severe bearish progress is the latest estimate labeling 42% of job losses permanent. Permanent changes to consumer behavior due to the global Covid-19 pandemic are not priced into financial markets, and fail to be reflected in economic models moving forward. The US government remained loyal to its preferred crisis management, consisting of adding to its unsustainable debt burden and hoping for a positive outcome. After the USD/CHF reached its short-term resistance zone, breakdown pressures have accumulated, supported by an increase in bearish momentum.
The Force Index, a next-generation technical indicator, shows the rejection by its descending resistance level, which led to a conversion of its horizontal support level into resistance. Adding to bearish developments was the collapse in the Force Index below its ascending support level, as marked by the green rectangle. Bears now await for this technical indicator to cross below the 0 center-line to resume complete control of the USD/CHF.
Annualized US interest payments surpassed $1 trillion and continue to climb. It directly reduces the necessary capital the economic infrastructure requires. With more debt being added without regard for fiscal responsibility, in conjunction with political pressure on the US Federal Reserve to adopt negative interest rates, the outlook for the US Dollar is excessively bearish. The USD/CHF is expected to complete a breakdown below its short-term resistance zone located between 0.9699 and 0.9727, as marked by the red rectangle.
Forex traders are recommended to monitor price action for a contraction below its ascending 61.8 Fibonacci Retracement Fan Support Level, which is approaching the bottom range of the short-term resistance zone. It is likely to force a more massive profit-taking sell-off, enhanced by the safe-haven status of the Swiss Franc, supported by a volume spike. The USD/CHF will then be cleared to accelerate down into its support zone located between 0.9587 and 0.9611, as identified by the grey rectangle. A breakdown extension cannot be ruled out, but a new catalyst will be required.
USD/CHF Technical Trading Set-Up - Profit-Taking Scenario
Short Entry @ 0.9715
Take Profit @ 0.9585
Stop Loss @ 0.9750
Downside Potential: 130 pips
Upside Risk: 35 pips
Risk/Reward Ratio: 3.71
In the event the Force Index accelerates above its ascending support level, the USD/CHF may attempt a breakout. Due to ongoing negative economic progress out of the US, any advance from current levels will present a secondary selling opportunity for Forex traders to consider. The upside potential remains limited to its long-term resistance zone located between 0.9784 and 0.9802.
USD/CHF Technical Trading Set-Up - Limited Breakout Scenario
Long Entry @ 0.9765
Take Profit @ 0.9800
Stop Loss @ 0.9750
Upside Potential: 35 pips
Downside Risk: 15 pips
Risk/Reward Ratio: 2.33

