S&P 500 Index Technical Analysis
The past few months has seen a lot of drama in stock markets, with the world’s leading stock index, the American S&P 500 Index, being no exception.
In late February, as it began to become clear that the novel coronavirus would have a strong impact upon most OECD nations, this Index fell from an all-time high and lost 20% more quickly than at any previous time in the last 100 years, including the crash of 1929.
By late March, 37% had been wiped off the value of the Index, and historical precedent suggested we would either see a strong and fast recovery which would go on to create a new bull market (as in 1987), or a continuing fall to even lower levels (as happened in 1929 and 2001).
A key indicator that can be useful in determining whether the stock market “crash” is over, is how much is regained by the first bullish retracement after an interim low is put in. Typically, markets that go on to make lower lows do not recover more than 50% of their initial peak to trough decline, or at best more than 61.8% (a Fibonacci level).
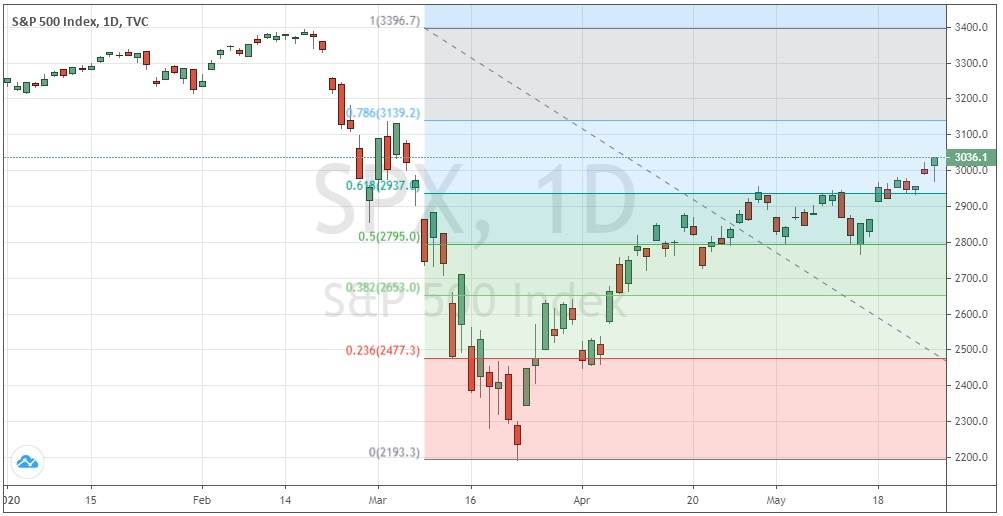
By this technical metric, the bulls have already won, and we look likely to see markets continue to rise as they did in 1987, when new all-time highs were quickly regained. The price chart below shows that the retracement levels of 50% and 61.8% have already been recovered. Adding to the bullish case is that the price action looks bullish even as it trades above the 61.8% level. Furthermore, two additional metrics are being surpassed: the price has made a daily close above both the 200-day simple moving average and also above the big psychological round number at 3000.
Technical analysis therefore points to a bull market and a continuing rise over June, especially if the last daily close in May is above 3000 and the 200-day simple moving average.
S&P 500 Index Fundamental Analysis
There have been few times in history where there has been such a seeming disconnect between the price action of a major stock index and the underlying economic situation.
The coronavirus pandemic is believed to have caused a tremendous amount of economic damage, with Goldman Sachs seeing something like 15% unemployment and a 30% drop in GDP as immediate near-term consequences.
Such negative fundamental analysis suggested that what we have been seeing in recent weeks is a “dead cat” bounce, which would surely turn dramatically bearish again.
However, it is important to remember that the market is not the economy, and that markets tend to look far ahead in their determination of value.
Bottom Line
If the price ends May above 3000, we are likely to see a further rise over June 2020.
There seems to be natural support at 2800 which is both a major round number and the 50% retracement level.
On the upside, it looks unlikely that the price could break to new all-time highs so quickly, so the 3400 is likely to cap the month’s high price.

