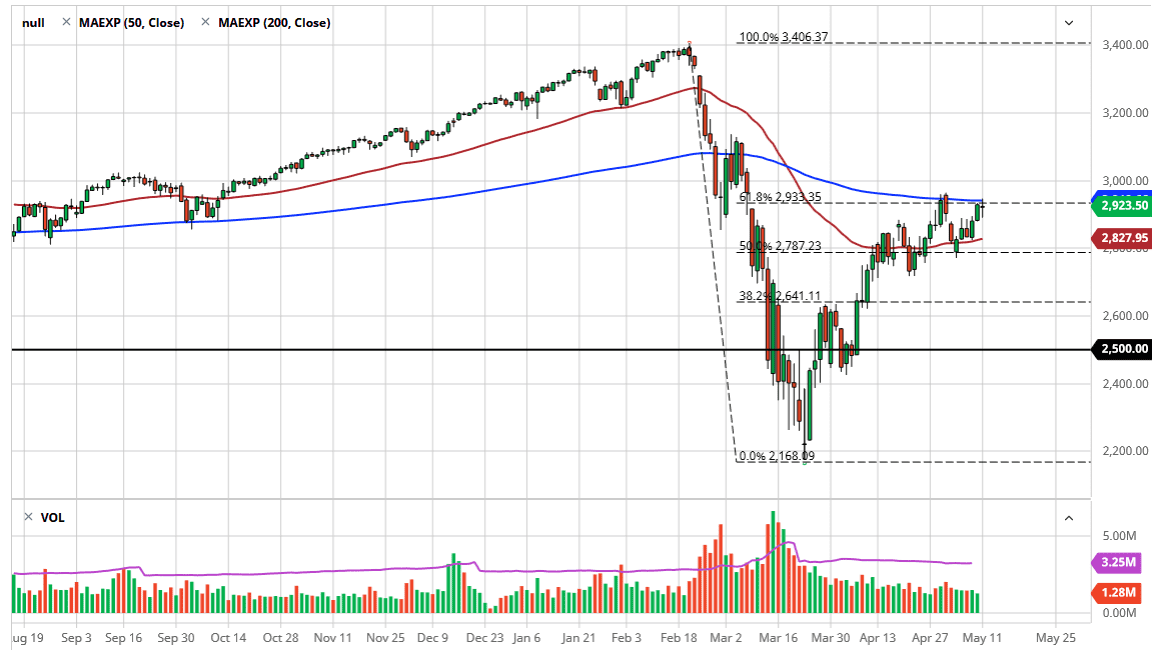
The S&P 500 went back and forth during the trading session on Monday, as the market has gotten far ahead of itself and one has to wonder whether or not the 200 day EMA will continue to hold as resistance. After all, we have the 61.8% Fibonacci retracement level sitting here as well, and then of course the gap from previous trading. Ultimately, this is a market that I think is going to bounce around between the 200 day EMA and the 50 day EMA. In other words, we are probably looking at a lot of choppy behavior going forward.
If we break down below the candlestick for the trading session on Monday, it is possible that we drift down to that 50 day EMA yet again. Ultimately, this is a sign that we are running into a lot of noise, and with that being the middle of the earnings season, it is likely that the markets will have plenty of noise to deal with. When you see so much in the way of noise, it typically is a good sign but this is a market that refuses to rollover. With so much Federal Reserve liquidity thrown into the marketplace, it is highly likely that we will continue to see a lot of money chasing other money in order to take advantage of the situation.
The candlestick is very neutral, so it does show that we are running out of momentum. Just above, we have the 200 day EMA as well as the 3000 level, so I think at this point it is only a matter of time before we get a little bit of a pullback. I like the idea of simply playing the range but given enough time if we break down below the 2800 level, it is likely that the market would drop all the way down to the 2640 handle. If we can finally clear the 3000 level, there is not much to keep the S&P 500 from taking off to much higher levels. After all, we have rallied for much longer than I have anticipated, but it is obvious that we are running out of momentum at this point in time. Fading rallies probably works, but as soon as the 3000 level gets closed above on a daily chart, then it is time to go much higher at that point as it is a major psychological level.