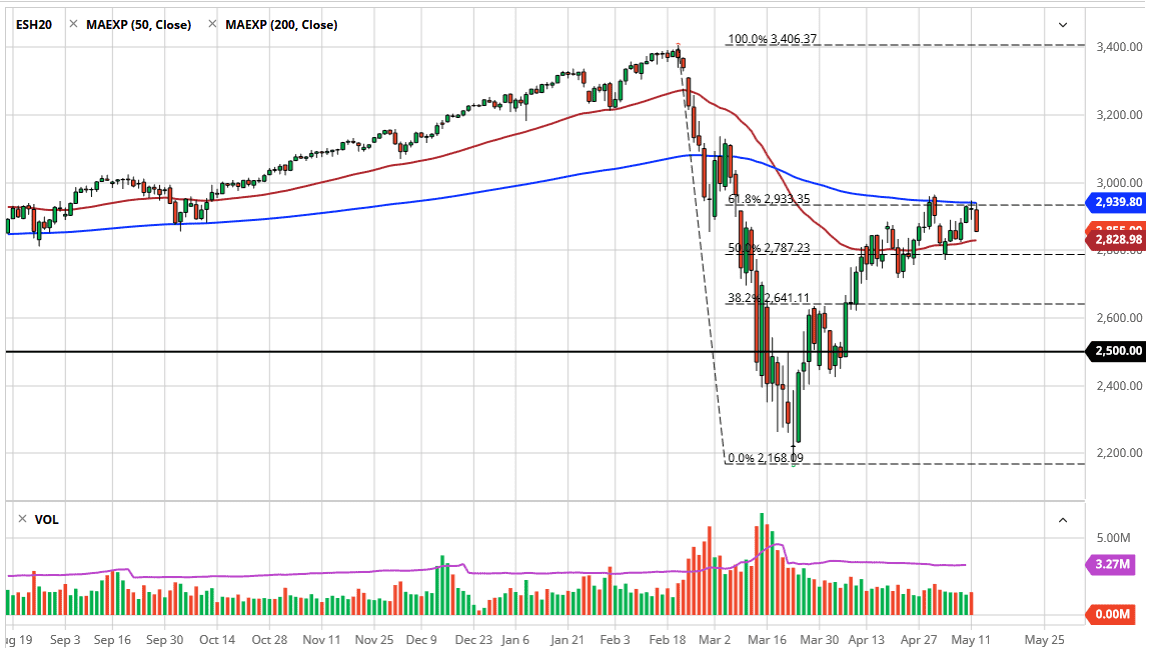
The S&P 500 initially tried to break above the 200 day EMA but could not succeed for the breakout. There has been a lot of noise in that general vicinity based upon not only the 200 day EMA above the 61.8% Fibonacci retracement level and of course the 3000 level being just above there. With that being the case and the market clearly recognizing that we are in some serious trouble as the momentum is dying, it does look like the market is ready to roll over and continue to go much lower if it only gets the rate catalyst.
In the meantime, though, it looks like the markets probably going to reach down towards the 2800 level. A breakdown below that level of course is extremely negative and could lead to further selling. This is a market that has defied gravity for quite some time, but we are starting to see it struggle at these high levels, and ultimately in that scenario I do think that we could see a continuation of the overall downtrend. When you look at volume, it has been extraordinarily light all the way up, so it shows no real conviction.
We are in the midst of earnings season so one feels that it would only take a couple of the wrong earnings announcements to send this market much lower. Furthermore, we have a lot of concerns out there about the coronavirus pandemic as economies continue to try to open up. Quite frankly, this is a market that has no business being this high, but you cannot fight the markets in general. Overall, I do think that it is only a matter of time before we pullback but I am also experienced enough to know that if we were to break above the 3000 handle, that would be an extraordinarily bullish sign and could send this market towards the 3100 level, and then finally the highs again. If that happens, it is very unlikely to see another major sell off because quite frankly this is an area that is “do or die” when it comes to the sellers. Looking at this chart, it just looks like a market that is ready to drop from here, so I do favor the downside overall, but I also recognize that this is an index that seemingly has nine lives. As a general, you should always short less as far as position size is concerned than going long.