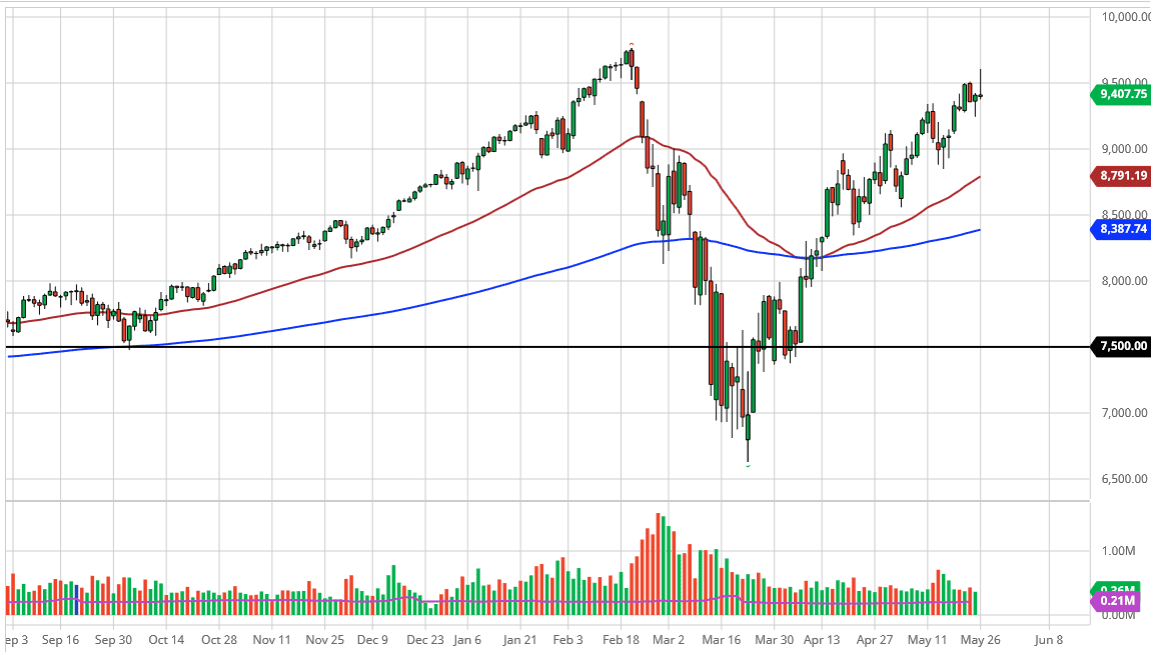
The NASDAQ 100 initially rally during the trading session on Tuesday as traders came back to markets in full force. At the end of the day, the market ended up forming a massive shooting star, showing signs of weakness at the 9500 level. I believe this level will continue to cause some issues, as we have seen a lot of “push and pull” around the world. I believe that the market will probably continue to see noise, but at the end of the day it is still a bullish trend.
If we break down below the lows of the trading session on Monday, that could open up some selling down towards the 9000 level underneath. The 50 day EMA is getting ready to reach towards that level as well, so ultimately this is a market that I think has plenty of buyers given enough time. Remember, the NASDAQ 100 essentially tracks a handful of stocks as some of the most popular and common stocks that Wall Street trades make up about 40% of the index. This includes Facebook, Microsoft, Google, Amazon, and Netflix. Furthermore, we have several cult stocks like Tesla that are right up there in value.
In other words, this is a market that is basically impossible to short, as we have seen of the last several months. Because of this, I look at pullbacks as a potential buying opportunity. However, this market breaks apart and sliced through the 9000 level one would have to pay attention to the S&P 500 to see how that may play out. After all, the S&P 500, although weighted a bit too much to the top as well, does tend to break apart much easier than the NASDAQ 100 does.
The 50 day EMA should offer plenty of support, which I believe will coincide nicely with 9000 if we do get a breakdown. The 200 day EMA looks as if it is reaching towards the 8500 level as well, so I think there will be plenty of opportunities to buy the NASDAQ 100 “on the cheap” if we do in fact get some type of breakdown. When you look at the chart, it is obvious that we are getting a bit stretched out, so do not be surprised to see a pullback in order to build up value if nothing else. At this point, building up a little bit of momentum is probably going to be necessary.