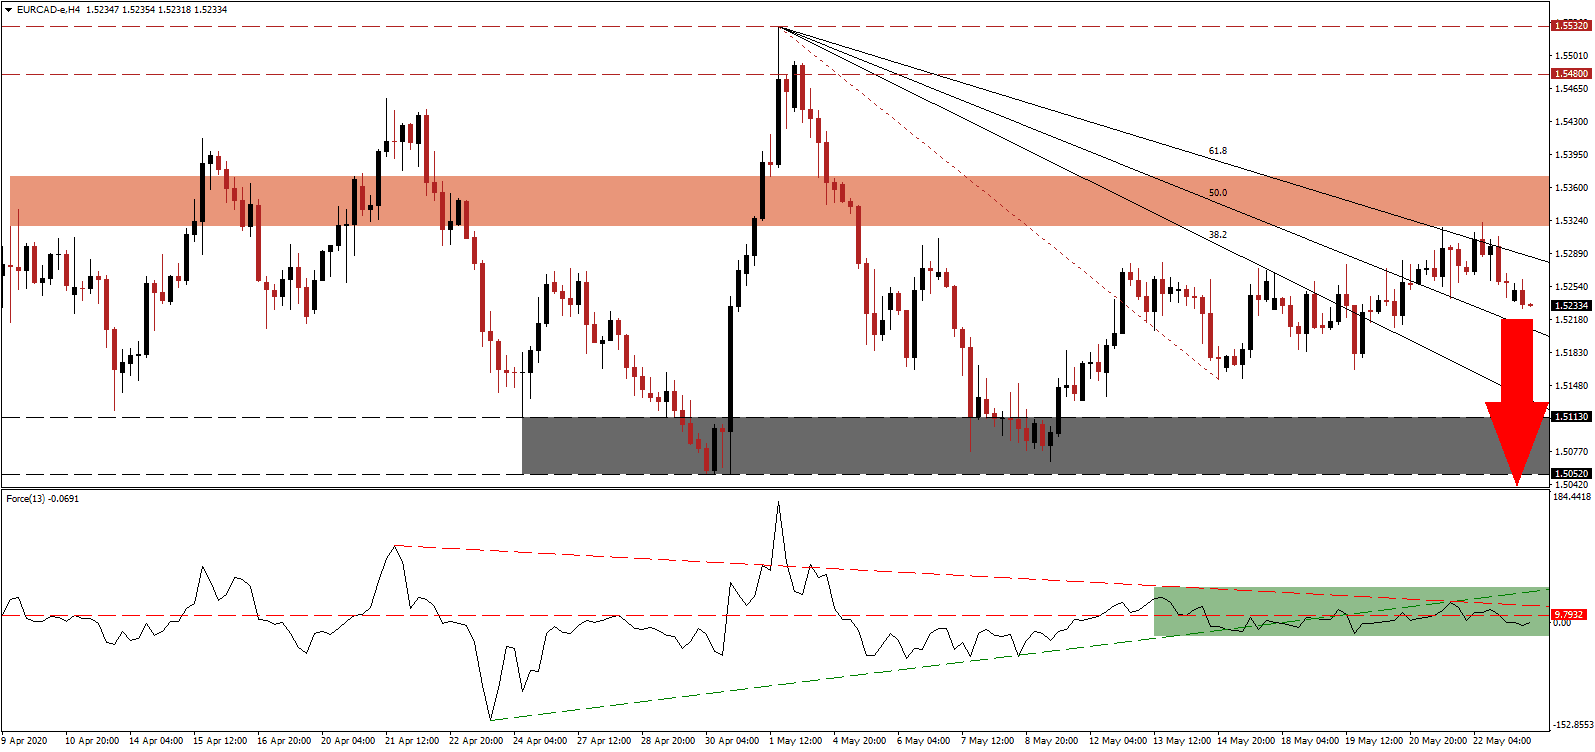
After the release of preliminary PMI data for May, it appears the Eurozone economy has bottomed out. The road to recovery remains long and painful, while a secondary contraction in data cannot be excluded. While global PMI data is showing an improvement, the comparison is against depressed data with the overall reading well-below the 50.0 level. The European Central Bank does not believe a return to pre-Covid-19 levels before 2021 at the earliest, and economic forecasts fail to account for a permanent change in consumer behavior. After the EUR/CAD was rejected by its short-term resistance zone, the descending 61.8 Fibonacci Retracement Fan Resistance Level is increasing downside pressure.
The Force Index, a next-generation technical indicator, points towards the build-up in bearish momentum, which advanced following the rejection by its descending resistance level, leading to a conversion of its horizontal support level into resistance. Adding to negative progress was the move in the Force Index below its ascending support level, as marked by the green rectangle. This technical indicator ceded control of the EUR/CAD to bears after contracting below the 0 center-line.
Canada faces significant challenges of its own, but Bank of Canada Governor Poloz has dismissed them. Per his account, the risks are overblown, and he remains confident about implemented policies. Complacency and false optimism represent a threat to the Canadian Dollar. While regional and the federal government are comfortable with raising debt and stimulating the economy, pressures to change direction to economic growth policies and away from support mechanisms are on the rise. In the medium-term, the EUR/CAD is poised to accelerate its breakdown sequence after the move below its short-term resistance zone located between 1.5318 and 1.5371, as marked by the red rectangle.
One essential level to monitor is the 50.0 Fibonacci Retracement Fan Support Level. A collapse in the EUR/CAD below is expected to initiate the next wave of selling in this currency pair and provide the required downside volume. Price action is anticipated to challenge its support zone located between 1.5052 and 1.5113, as identified by the grey rectangle. More downside is probable, driven by excessive Eurozone weakness, with the next support zone located between 1.4792 and 1.4868.
EUR/CAD Technical Trading Set-Up - Breakdown Extension Scenario
Short Entry @ 1.5235
Take Profit @ 1.4800
Stop Loss @ 1.5335
Downside Potential: 435 pips
Upside Risk: 100 pips
Risk/Reward Ratio: 4.35
In the event the Force Index reclaims its ascending support level, presently acting as resistance, the EUR/CAD could be inspired into a breakout. With the economic outlook for the Eurozone direr than that of Canada, both home to central banks that fail to comprehend the negative long-term impact of their destructive monetary policies, forex traders should consider any advance as a short-selling opportunity. The upside potential remains confined to its resistance zone located between 1.5480 and 1.5532.
EUR/CAD Technical Trading Set-Up - Confined Breakout Scenario
Long Entry @ 1.5400
Take Profit @ 1.5530
Stop Loss @ 1.5335
Upside Potential: 130 pips
Downside Risk: 65 pips
Risk/Reward Ratio: 2.00

