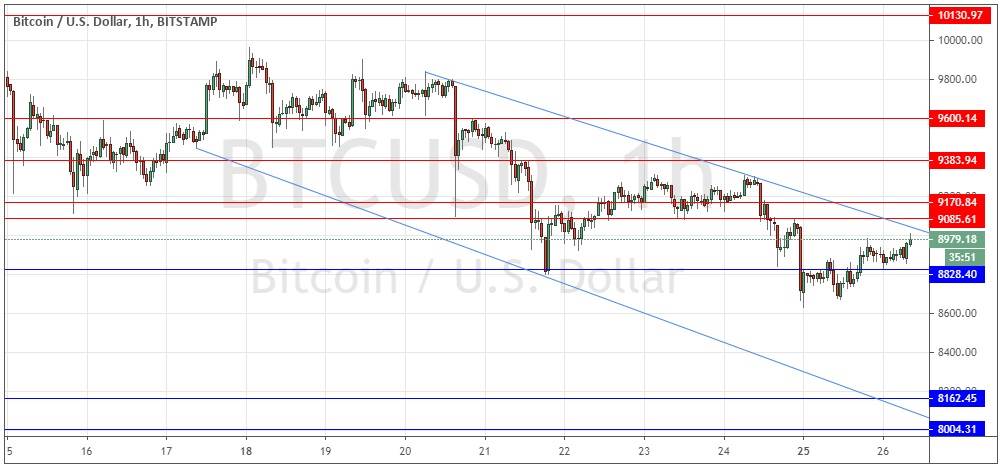
BTC/USD: Price is ranging over the long term
Yesterday’s signals were not triggered as there was no bearish price action when the former resistance level at $8,818 was reached.
Today’s BTC/USD Signals
Risk 0.50% per trade.
Trades may only be entered before 5pm Tokyo time Wednesday.
Long Trade Ideas
Long entry after a bullish price action reversal on the H1 time frame following the next touch of $8,828, $8,162, or $8,004.
Place the stop loss $50 below the local swing low.
Move the stop loss to break even once the trade is $50 in profit by price.
Remove 50% of the position as profit when the trade is $50 in profit by price and leave the remainder of the position to run.
Short Trade Ideas
Short entry after a bearish price action reversal on the H1 time frame following the next touch of $9,086, $9,173 or $9,600.
Place the stop loss $50 above the local swing high.
Move the stop loss to break even once the trade is $50 in profit by price.
Remove 50% of the position as profit when the trade is $50 in profit by price and leave the remainder of the position to run.
The best method to identify a classic “price action reversal” is for an hourly candle to close, such as a pin bar, a doji, an outside or even just an engulfing candle with a higher close. You can exploit these levels or zones by watching the price action that occurs at the given levels.
BTC/USD Analysis
I wrote yesterday that I would be very careful trading this pair, the action looked tricky and unpredictable with signs that we were going to get a bullish movement over the coming hours.
If the price could get established later above $9,173, I thought that would be a bullish sign.
This was a good call as I was correct to anticipate the danger of a bullish movement.
The technical picture now is more clearly bearish, as we can see a fairly wide symmetrical bearish channel has been running for approximately 9 days.
We are near the top of this channel, so I would be very interested in a short trade from a bearish reversal which clearly rejects both the trend line shown in the price chart below, and the horizontal resistance it is currently confluent with at $9,086.
The outlook is generally bearish for Bitcoin, although over the long-term the price is in a range. There is nothing of high importance due today concerning the USD.
