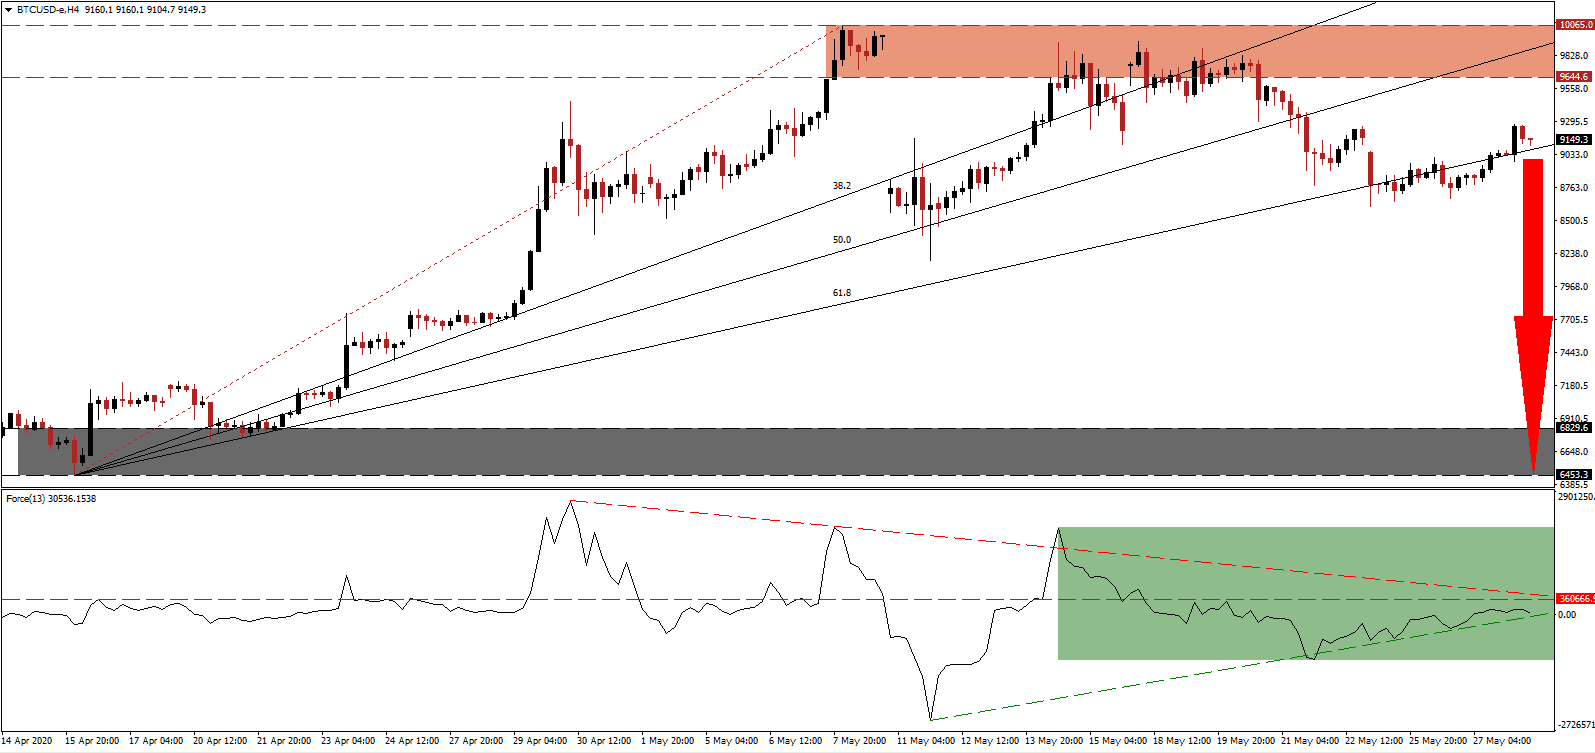
One of the most over-hyped events for Bitcoin was the third halving event, which concluded on May 11th, 2020. Rewards for miners, the backbone of the network, were reduced, as the name suggests, by 50% from 12.50 Bitcoin to 6.25. The BTC/USD collapsed with a massive price gap to the downside below its resistance zone, before recovering to a lower high and correcting once again. Sentiment has also turned bearish on this cryptocurrency pair, which is positioned for a more massive correction on the back of expanding breakdown pressures. While it remains premature to properly evaluate the third halving event as a success or a failure in terms of price appreciation, it failed to live up to the previous two.
The Force Index, a next-generation technical indicator, confirms the build-up in downside pressure, enhanced by its descending resistance level. With the Force Index below its horizontal resistance level, as marked by the green rectangle, the rise in bearish momentum is favored to push it below its ascending support level and into negative territory. Bears will then regain complete control of the BTC/USD.
Unique Twitter posts about Bitcoin collapsed by 56% since the halving, per data analytics firm Santiment, confirming a vacuum of positive sentiment. More tweets are bearish than bullish for the first time since April 13th. With the cryptocurrency sector labeled a retail phenomenon, Twitter emerged as a primary communication tool, and activity is often used for sentiment analysis. Bearish momentum remains dominant after the BTC/USD completed a second breakdown below its resistance zone located between 9,644.6 and 10,065.0, as marked by the red rectangle.
Traders are advised to monitor price action for a pending contraction below its ascending 61.8 Fibonacci Retracement Fan Support Level. It represents the final support separating this cryptocurrency pair for more downside. A breakdown is expected to attract a new wave of net sell orders, adding the required volume for an extended sell-off. The BTC/USD is vulnerable to crash into its next support zone located between 6,453.3 and 6,829.6, as marked by the grey rectangle. Volatility is poised to expand as traders attempt to price the halving event accurately, but the absence of bulls risks a violent collapse.
BTC/USD Technical Trading Set-Up - Breakdown Extension Scenario
- Short Entry @ 9,150.0
- Take Profit @ 6,500.0
- Stop Loss @ 9,650.0
- Downside Potential: 265,000 pips
- Upside Risk: 50,000 pips
- Risk/Reward Ratio: 5.30
In the event the Force Index accelerates above its descending resistance level, the BTC/USD may be pressured higher. Bullish attempts to eclipse the psychologically important 10,000 level have failed. While a short-term burst could elevate price action temporarily above it, traders are advised to consider this a selling opportunity on the back of fundamental breakdown pressures enhanced by technical developments. The next resistance zone awaits this cryptocurrency pair between 10,377.2 and 10,505.3.
BTC/USD Technical Trading Set-Up - Limited Breakout Scenario
- Long Entry @ 9,925.0
- Take Profit @ 10,500.0
- Stop Loss @ 9,650.0
- Upside Potential: 57,500 pips
- Downside Risk: 27,500 pips
- Risk/Reward Ratio: 2.09

