Oil prices tanked to start the new trading week after a report labeled the US oil sector dire. It confirmed that OPEC+ has no control of the market. After the cartel and its non-members announced an unprecedented supply cut of 9.7 million barrels per day, approximately 10% of total capacity, prices initially stabilized. While sub-20 per barrel oil does not reflect fundamental conditions, it is likely to force more bankruptcies across the US shale producers. Saudi Arabian exports to the US surged last month, and the country may once again become a net importer if ongoing developments force severe long-term supply cuts. Breakdown pressures in the USD/ZAR are accumulating, despite South Africa’s continuous issues.
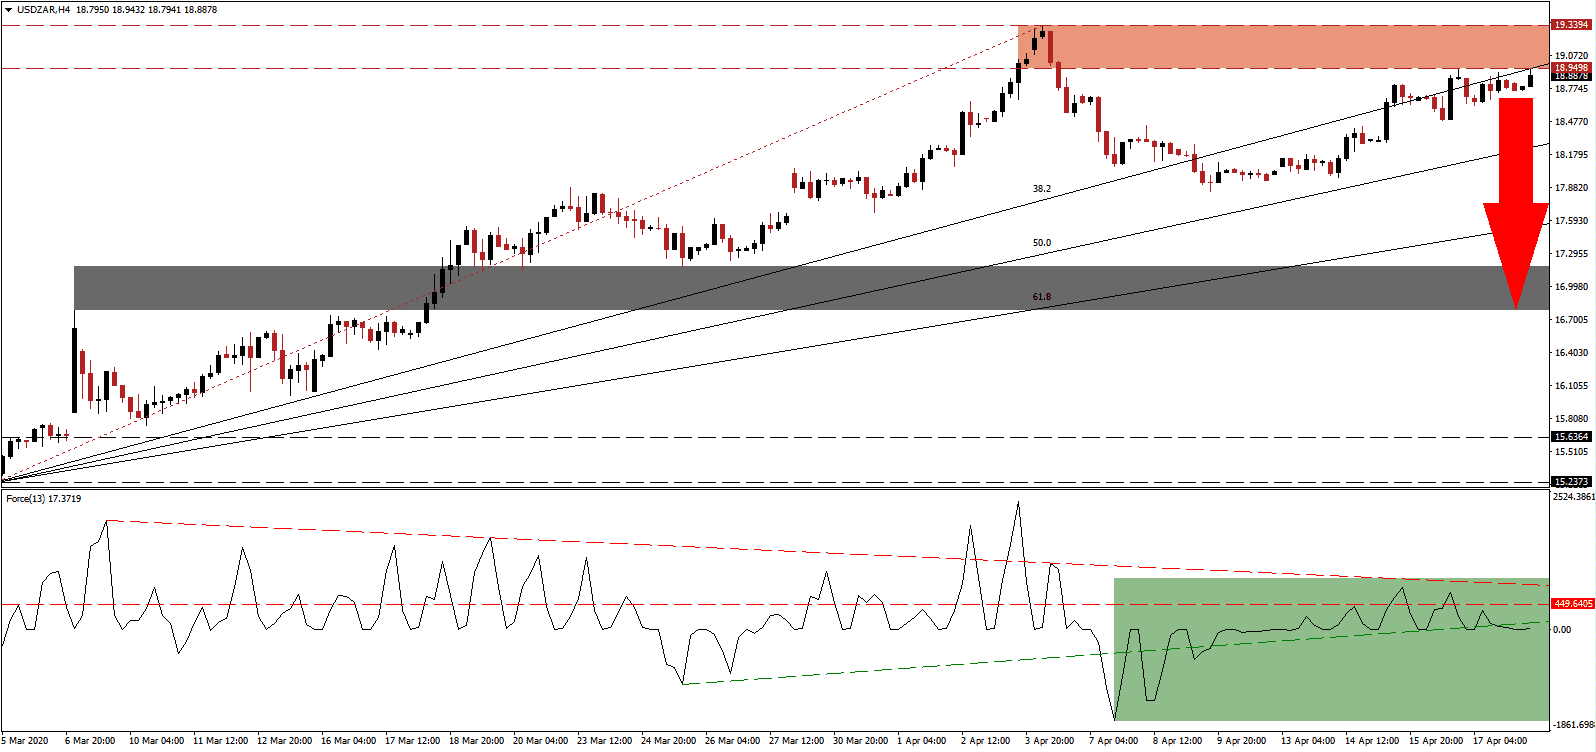
The Force Index, a next-generation technical indicator, formed a series of lower highs. It confirms the dominance of bearish pressures, with the descending resistance level contributing to downside momentum. The Force Index remains below its horizontal resistance level, as marked by the green rectangle. Adding to negative progress was the breakdown in this technical indicator below its ascending support level. A push into negative territory is favored to follow, ceding control of the USD/ZAR to bears.
While price action drifted higher, bullish momentum extended its contraction. The negative divergence provides traders with an additional red flag that a sell-off is on the horizon. It was enhanced after the ascending 38.2 Fibonacci Retracement Fan Resistance Level crossed into the resistance zone located between 18.9498 and 19.3394, as marked by the red rectangle. South Africa may be forced to implement long-term positive economic adjustments do to the global Covid-19 pandemic, avoided by its politicians, which include a sweeping tax overhaul and necessary labor reforms. It adds a long-term bullish fundamental catalyst to the South African Rand and a bearish one for the USD/ZAR.
While short-term negative progress is dominant, the response and costs of governments to the virus will slowly surpass the focus on daily infection numbers and the death toll. South Africa is in a unique position to solve fundamental problems, placing the economy on a sustained path to sustained economic recovery. The US is faced with a more severe crisis than its leadership is willing to accept, with November elections shaping official announcements. The USD/ZAR is anticipated to correct into its short-term support zone located between 16.7809 and 17.1742, as identified by the grey rectangle. A breakdown extension is possible, but a new catalyst required.
USD/ZAR Technical Trading Set-Up - Breakdown Scenario
Short Entry @ 18.9000
Take Profit @ 16.8000
Stop Loss @ 19.3500
Downside Potential: 21,000 pips
Upside Risk: 4,500 pips
Risk/Reward Ratio: 4.67
A breakout in the Force Index above its descending resistance level is expected to push the USD/ZAR into a temporary move above its resistance zone. Due to the underestimated US economic weakness moving forward, Forex traders are recommended to cautiously view any price spike from current levels as a selling opportunity. The upside potential remains confided to its next resistance zone between 20.4061 and 20.6123.
USD/ZAR Technical Trading Set-Up - Limited Breakout Scenario
Long Entry @ 19.5000
Take Profit @ 20.5000
Stop Loss @ 19.0000
Upside Potential: 10,000 pips
Downside Risk: 5,000 pips
Risk/Reward Ratio: 2.00

