Turkey’s economy is feeling the devastating impact of the global Covid-19 pandemic. Worries over the foreign-dominated debt have spiked, and for the first time since the 2018 currency crisis, the USD/TRY eclipsed 7.0000. It is faced with the same array of problems but has one essential asset absent from most economies, gold. Since the outbreak of the pandemic, Turkish banks and gold refineries placed over 100 tones of the precious metal from peoples home’s back into the economy. An estimated 3,000 to 5,000 tons of gold are stashed away by consumers, worth $200 to $300 billion. A leading gold refinery entered into a collaborative deal with twelve banks to unlock this value, which will solve many financial problems the country faces. The USD/TRY is anticipated to enter a profit-taking sell-off, as current levels are neither reflective of fundamentals nor sustainable.
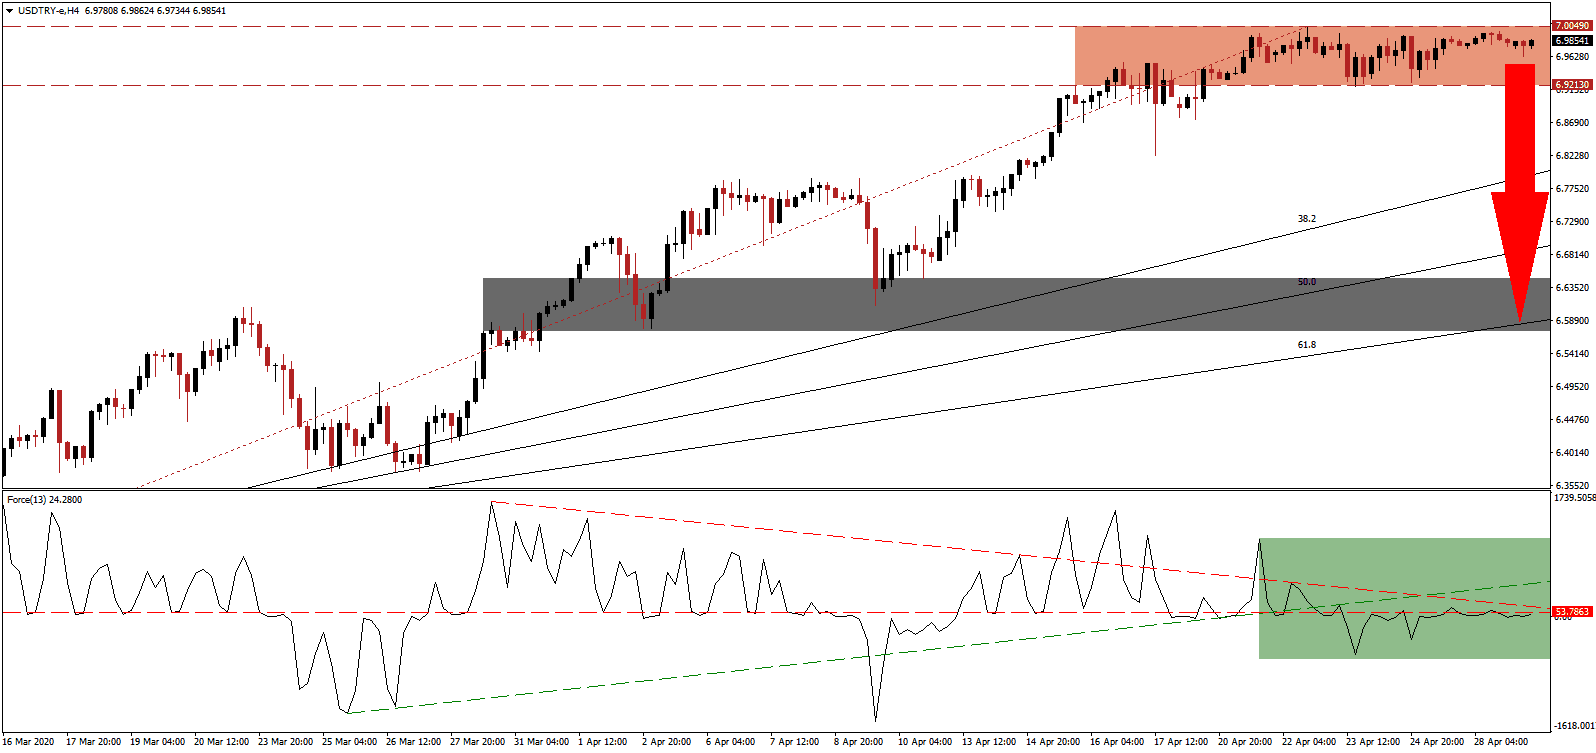
The Force Index, a next-generation technical indicator, offers an initial warning that the advance in this currency pair is approaching its end. A negative divergence materialized as price action entered its resistance zone while the Force Index drifted lower. It collapsed below its ascending support and converted its horizontal support level into resistance, as marked by the green rectangle. More downside pressure is provided by the descending resistance level, favored pressuring this technical indicator into negative territory, allowing bears to regain control of the USD/TRY.
Reserves at Turkey’s central bank declined by $16 billion to $24 billion this year, with an external debt of $170 billion expected for 2020. The vast gold reserves offer a sustainable path forward if the population is willing to participate. Covid-19 may provide the necessary catalyst to force permanent positive economic changes globally. They will be painful in the short-term to medium-term. Failure to realize the long-term potential will position the global economy for more significant stress, especially following the US-led debt binge. Volatility in the USD/TRY is likely to precede a breakdown below its resistance zone located between 6.9213 and 7.0049, as identified by the red rectangle.
Price action is positioned to close the gap to its ascending 38.2 Fibonacci Retracement Fan Support Level, following the pending breakdown. Another essential level to monitor is the intra-day low of 6.8217, the base of the previous correction below its resistance zone. A move lower is favored to attract new net sell orders, providing volume for a breakdown extension in the USD/TRY into its short-term support zone. This zone is located between 6.5731 and 6.6484, as marked by the grey rectangle, enforced by its 61.8 Fibonacci Retracement Fan Support Level. More downside is possible with a fresh fundamental catalyst.
USD/TRY Technical Trading Set-Up - Profit-Taking Scenario
Short Entry @ 6.9850
Take Profit @ 6.6000
Stop Loss @ 7.1000
Downside Potential: 3,850 pips
Upside Risk: 1,150 pips
Risk/Reward Ratio: 3.35
Should the Force Index reclaim its ascending support level, serving as temporary resistance, the USD/TRY may attempt a breakout. Given existing fundamental conditions, supported by technical developments, any advance is favored to represent a short-term event and excellent short selling opportunity for Forex traders to consider, as this currency pair explores unchartered territory. The next resistance zone is located between 7.3581 and 7.4317.
USD/TRY Technical Trading Set-Up - Limited Breakout Scenario
Long Entry @ 7.2000
Take Profit @ 7.4000
Stop Loss @ 7.1000
Upside Potential: 2,000 pips
Downside Risk: 1,000 pips
Risk/Reward Ratio: 2.00

