Economists forecast a slower recovery in Canada as compare to the US. The ongoing collapse in oil prices is posing a vital challenge to both economies. Canada has relied on energy as a significant pillar of job creation and revenue but may use the global Covid-19 pandemic to diversify into renewable energy. Over the past years, the US transition from a net importer to an exporter on the back shale producers. The US sector is now faced with a likely spike in bankruptcy filings and mass lay-offs. It will add to over 30 million job losses, which are expected by the end of April. The USD/CAD exhausted its upside potential at its short-term resistance zone from where a reignition of the corrective phase is expected.
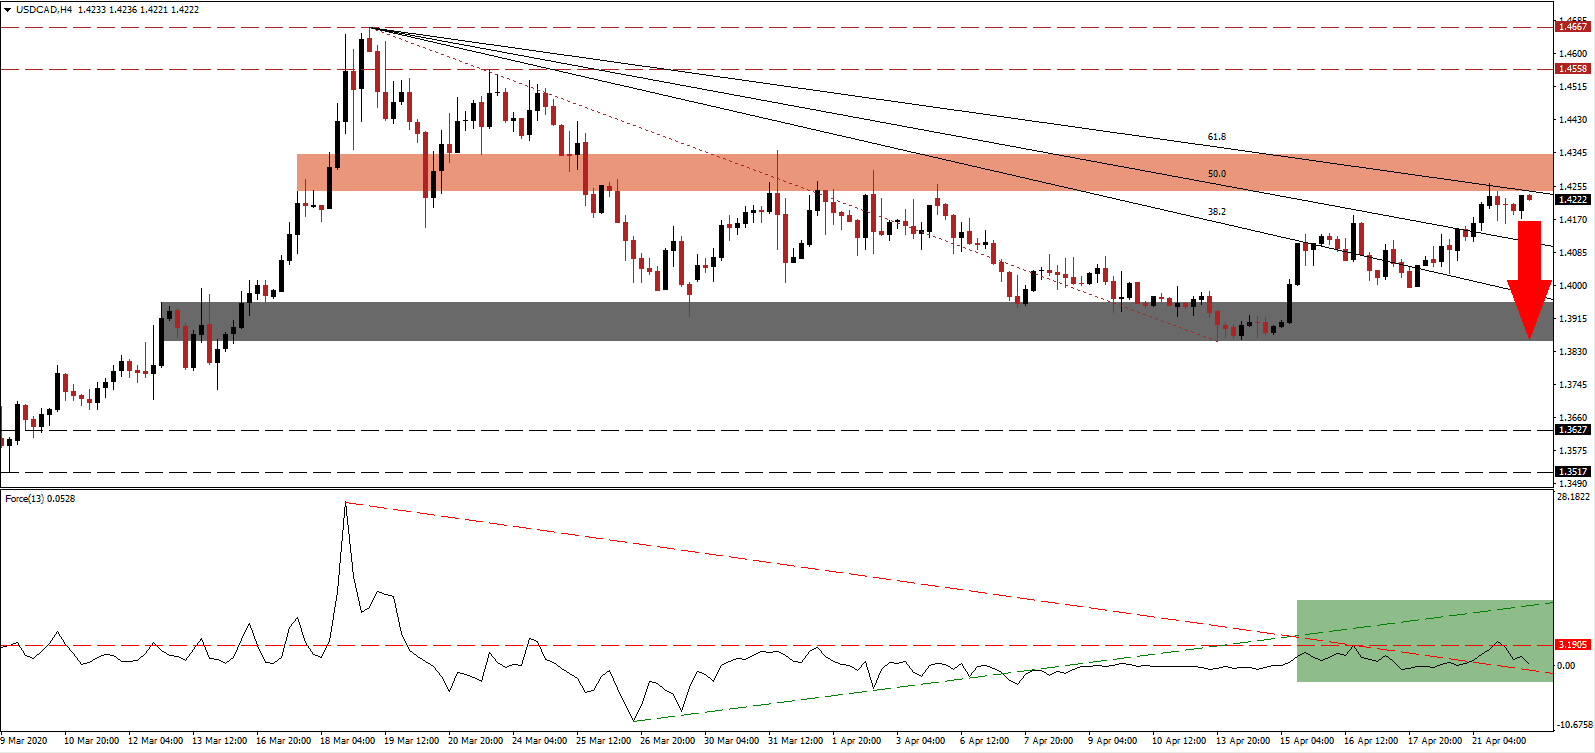
The Force Index, a next-generation technical indicator, points towards the loss of bullish momentum, and corrected below its horizontal support level, converting it into resistance. Adding to bearish developments is the move farther away from its ascending support level, as marked by the green rectangle. The Force Index is on track to collapse below its descending resistance level and into negative territory. Once this technical indicator crosses below the 0 center-line, bears will regain control of the USD/CAD.
May oil futures plunged into negative territory for the first time in history, settling at -$38.52 for WTI crude on Monday. Headlines were crowded with the development, but the contracts expired on Tuesday with the June contract in effect since today. The shock of this historic collapse sent shockwaves through energy-dependent economies like Canada, with the USD/CAD reaching the bottom range of its short-term resistance zone located between 1.4244 and 1.4338, as identified by the red rectangle. It is enforced by the descending 61.8 Fibonacci Retracement Fan Resistance Level.
Despite the advance, momentum in this currency pair remains increasingly bearish. The Fibonacci Retracement Fan sequence is anticipated to force a profit-taking sell-off. One essential level to monitor is the intra-day high of 1.4181, the last rejection of the USD/CAD by its 50.0 Fibonacci Retracement Fan Resistance Level. A breakdown will provide the necessary volume for an extension of the sell-off into its short-term support zone located between 1.3855 and 1.3956, as marked by the grey rectangle. More downside cannot be excluded due to accumulating weakness in the US recovery prospects.
USD/CAD Technical Trading Set-Up - Profit-Taking Scenario
Short Entry @ 1.4225
Take Profit @ 1.3855
Stop Loss @ 1.4345
Downside Potential: 370 pips
Upside Risk: 120 pips
Risk/Reward Ratio: 3.08
A breakout in the Force Index above its ascending support level, serving as present resistance, is likely to entice a push higher in the USD/CAD. With job losses in the US on track to exceed 30 million by the end of next week or 50% more over the past two months than the economy created since 2009, the outlook is increasingly bearish. Forex traders are advised to consider any advance from the current level an excellent selling opportunity. The next resistance zone awaits price action between 1.4558 and 1.4667.
USD/CAD Technical Trading Set-Up - Limited Breakout Scenario
Long Entry @ 1.4425
Take Profit @ 1.4635
Stop Loss @ 1.4345
Upside Potential: 210 pips
Downside Risk: 80 pips
Risk/Reward Ratio: 2.63

