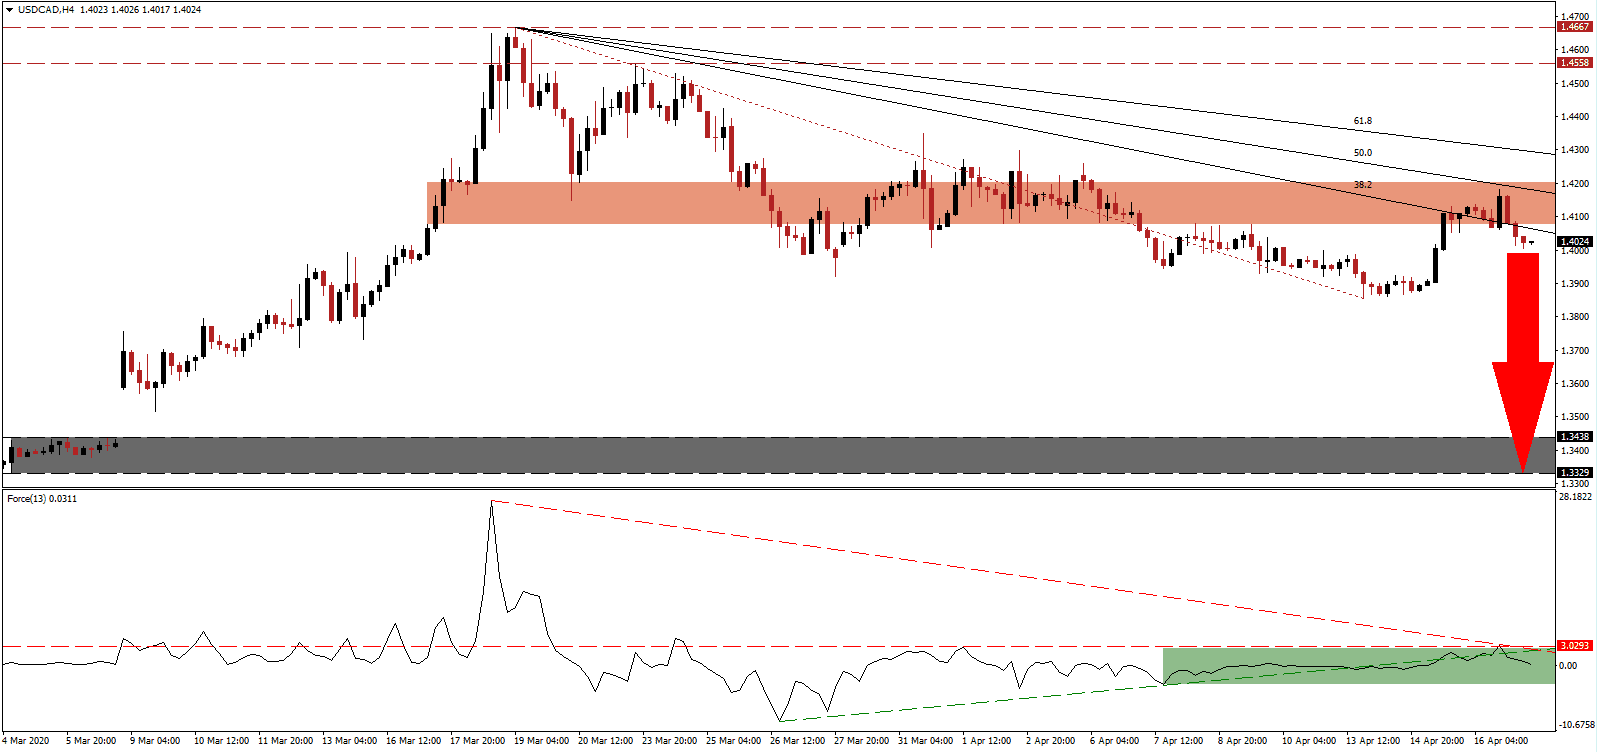
Optimism on the prospects of Gilead Sciences’ remdesivir swelled after promising results of one Phase 3 trial were leaked, but the economy remains at the root of a global recession. Multiple forecasts agree it will be the most severe downturn since the Great Depression of 1933. Even if a cure is confirmed, many unknowns remain about the Covid-19 virus. The global economy was faced with a wide range of issues before the pandemic. Government reactions to the outbreak have intensified them, suggesting a prolonged downturn. After the USD/CAD completed a double breakdown, a profit-taking sell-off is favored to materialize.
The Force Index, a next-generation technical indicator, remains in positive territory after being rejected by its horizontal resistance level. Adding to downside pressure is the descending resistance level, which already pressures the Force Index below its ascending support level, as marked by the green rectangle. Bears will regain full control of price action in the USD/CAD once this technical indicator crosses below the 0 center-line. You can learn more about the Force Index here.
Bearish pressures mounted after the USD/CAD contracted below its short-term resistance zone located between 1.4077 and 1.4201, as identified by the red rectangle. It was followed by a breakdown below its descending 38.2 Fibonacci Retracement Fan Support Level, converting it into resistance. Yesterday’s US initial jobless claims report showed an additional 5.245 million filings, carrying the four-week total to over 22 million. It practically eliminated all jobs created since the Great Recession of 2008.
Canada faces a multitude of problems, but pale in comparison to mounting US worries. While oil prices are anticipated to remain depressed for an extended period, Canada possesses the will to implement long-lasting positive changes to its economic model. In comparison, the US favors increasing debt to maintain an outdated and destructive long-term approach. The USD/CAD is expected to accelerate into its support zone located between 1.3329 and 1.3438, as marked by the grey rectangle.
USD/CAD Technical Trading Set-Up - Breakdown Extension Scenario
Short Entry @ 1.4025
Take Profit @ 1.3350
Stop Loss @ 1.4225
Downside Potential: 675 pips
Upside Risk: 200 pips
Risk/Reward Ratio: 3.38
A sustained breakout in the Force Index above its ascending support level, serving as resistance, is likely to pressure the USD/CAD into a short-term reversal. The bearish trend is enforced by its 61.8 Fibonacci Retracement Fan Resistance Level. Forex traders are recommended to take advantage of any breakout above it with new net short orders. The upside potential is limited to its resistance zone located between 1.4558 and 1.4667.
USD/CAD Technical Trading Set-Up - Limited Breakout Scenario
Long Entry @ 1.4325
Take Profit @ 1.4550
Stop Loss @ 1.4225
Upside Potential: 225 pips
Downside Risk: 100 pips
Risk/Reward Ratio: 2.25

