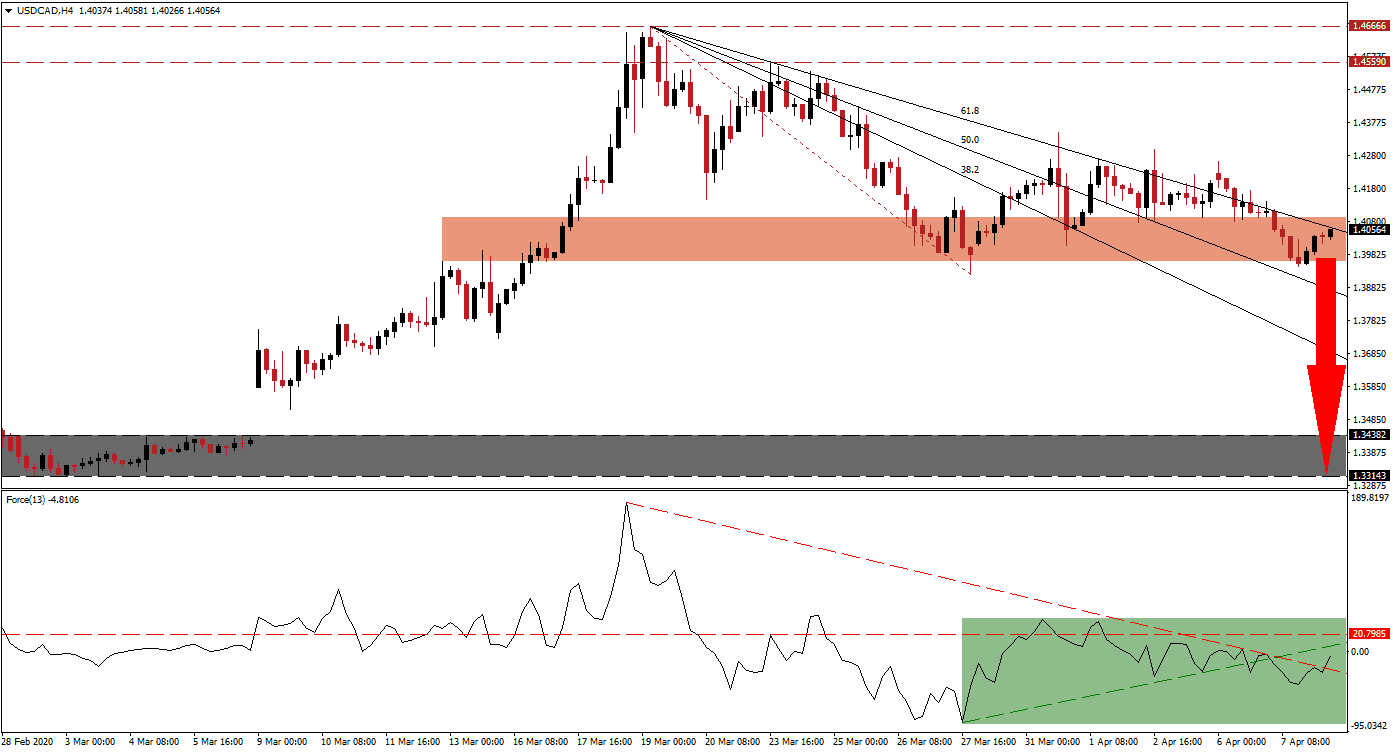
Covid-19 related economic disruptions remain severely underestimated by financial markets, especially the long-term implications of it. US initial jobless claims over the past two weeks alone totaled ten million, with an additional five million predicted from tomorrow’s report. The number is expected to increase, and even the US Fed warned of a spiking unemployment rate as high as 30% in a worst-case scenario. US economic activity is fueled by debt-driven consumerism, which is now materially impacted. Household wealth destruction is in the early stage, while the US government debt-to-GDP ratio is approaching levels that forced a bailout in Greece. Conditions are ideal for the USD/CAD to collapse into its next support zone.
The Force Index, a next-generation technical indicator, confirms the lack of bullish momentum. Following the conversion of its horizontal support level into resistance, a breakdown below its ascending support level materialized. The Force Index pushed above its descending resistance level, as marked by the green rectangle, and is anticipated to challenge its ascending support level before contracting into a lower low. This technical indicator remains below the 0 center-line, granting bears control of the USD/CAD.
Canada faces significant challenges ahead, but they are less severe than those of the US economy. Where Canada may use this global pandemic to recalibrate its economic focus, the US remains on track to prolong existing practices. The USD/CAD is under renewed breakdown pressure inside of its short-term support zone located between 1.39600 and 1.40933, as marked by the red rectangle. The descending 61.8 Fibonacci Retracement Fan Resistance Level is adding to downside momentum.
Forex traders are recommended to monitor the intra-day low of 1.39211, the current base of the breakdown sequence, and end-point to the redrawn Fibonacci Retracement Fan sequence. A breakdown is likely to attract the next wave of sell orders, providing the necessary volume to allow the corrective phase to accelerate to the downside. The subsequent support zone awaits the USD/CAD between 1.33143 and 1.34382, as identified by the grey rectangle. You can learn more about a breakdown here.
USD/CAD Technical Trading Set-Up - Breakdown Scenario
- Short Entry @ 1.40550
- Take Profit @ 1.33150
- Stop Loss @ 1.42700
- Downside Potential: 740 pips
- Upside Risk: 215 pips
- Risk/Reward Ratio: 3.44
Should the Force Index spike above its ascending support level, operating as temporary resistance, the USD/CAD is feasible to attempt a price action reversal. Due to developing long-term fundamental trends, the upside potential remains limited to its long-term resistance located between 1.45590 and 1.46666. Forex traders are advised to consider any advance from current levels as a prominent short-selling opportunity.
USD/CAD Technical Trading Set-Up - Limited Breakout Scenario
- Long Entry @ 1.43600
- Take Profit @ 1.45600
- Stop Loss @ 1.42700
- Upside Potential: 200 pips
- Downside Risk: 90 pips
- Risk/Reward Ratio: 2.22

