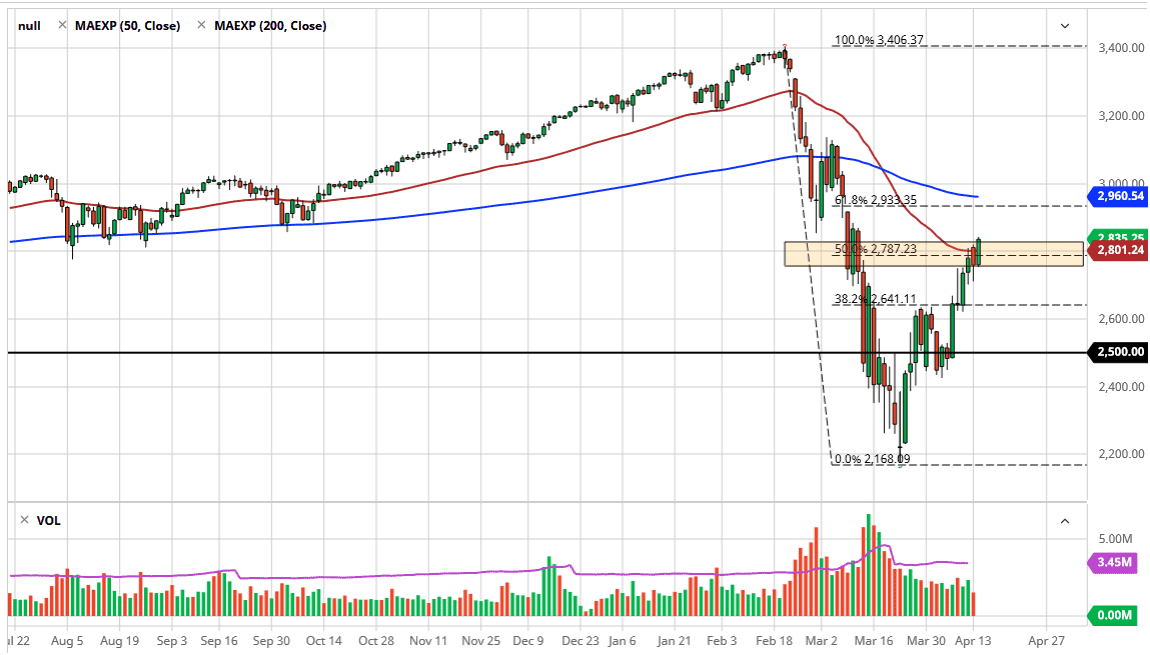
The S&P 500 has rallied significantly during the trading session on Tuesday, clearing the 50 day EMA quite handily. Furthermore, we have broken above the 50% Fibonacci retracement level, and closed at the top of the candlestick. While I do see a significant amount of resistance in the area of 2860, I think we are more than likely going to go looking towards the gap above.
The 61.8% Fibonacci retracement level is in that same area as well, as well as the 200 day EMA. Quite frankly, I do think that this market pulls back sooner rather than later but I think we may have to fill that gap first. For what it’s worth though, the NASDAQ 100 has already filled its gap and blew through it like it wasn’t even there. Because of this, that possibility is still on the table as well. Just above the gap there is the 3000 level though, and it looks to me like we will probably continue to look at that as a potential barrier. If we break above there, then we will go looking towards the 3150 handle.

The S&P 500 is going through earnings season, but at this point it looks very likely that the trading community is more than willing to give companies a pass when it comes to earnings, so I think this may be used as an excuse to simply buy stocks and try to get back to the top. That being said, if we were to break down below the 2750 level, then I think we could get a significant pullback, perhaps to the 2600 level or the 2500 level. While this does look like a ridiculous chart to me considering just how sharp the rise has been, the reality is that the selloff was just as drastic. In other words, this is what a highly computerized trading scenario looks like. The volatility is much worse in times of panic than it was years ago, as millions of trades are made in milliseconds, not necessarily with anything other than a mathematical formula behind them. Regardless, even though I do think that there are a lot of issues going forward, the reality is that the technical analysis suggests that dips will be bought, as we finished so strong in New York. Selling at this point seems to be very unlikely for anything more than a value proposition for short-term traders.
