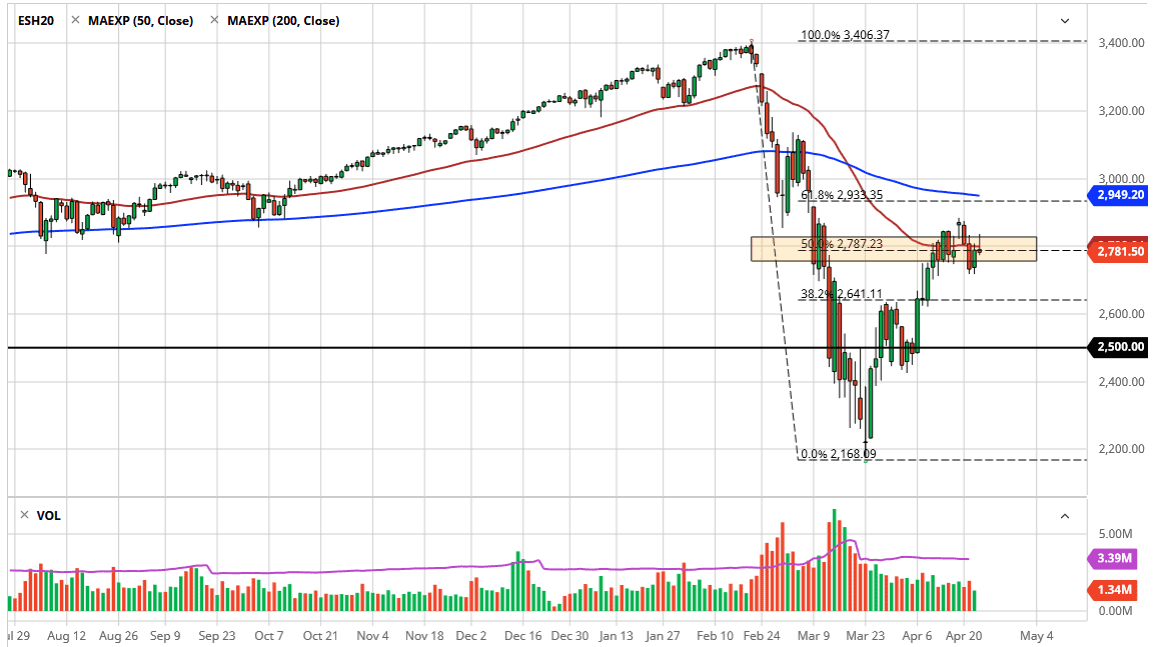
The S&P 500 rallied a bit during the trading session on Thursday but gave back the gains in order to form a bit of a shooting star. The shooting star is being stamped on by the 50 day EMA and we are in the middle of massive consolidation. It should also be noted that the 50 day EMA in the 2800 level all sit in the same area. In fact, what was once an extraordinarily strong looking day suddenly got slammed a leader in the afternoon and this suggests that we are probably going to see continued sluggish behavior.
With the market running out of momentum, the easiest path will be down, at least for the short term. The S&P 500 at one point had gained 50 points but ended up closing down one point. That is not a good look, and it more than likely will have people a bit concerned. At the same time, treasuries gained a bit and some of the riskier assets around the world loss quite a bit of momentum. This shows that perhaps people are a bit concerned when it comes to risk appetite.
I would also draw your attention to the volume graph at the bottom of the chart. Notice that the entire rally has been rather thin as far as volume is concerned, so therefore I have to wonder whether or not this is the real deal, or we are starting to see the end of a simple “bear market rally?” I think the next couple of days could give us an idea as to whether or not it is, but the trading action on Thursday certainly did nothing to dispel that possibility. If we break down below the lows of the Tuesday and Wednesday session, that could open up a move down to the 2640 handle, and then the 2500 level after that. Alternately, if the market was to break above the top of the candlestick during the trading session on Thursday, then we will test the recent highs closer to the 2885 level, and then make a move towards the 200 day EMA which is currently hugging the 61.8% Fibonacci retracement level, and perhaps even more importantly a gap in the futures contract above. It is possible this is a market that has simply gotten ahead of itself and needs to consolidate at lower levels in order to attract some value hunters. Furthermore, the economic numbers are abysmal.

