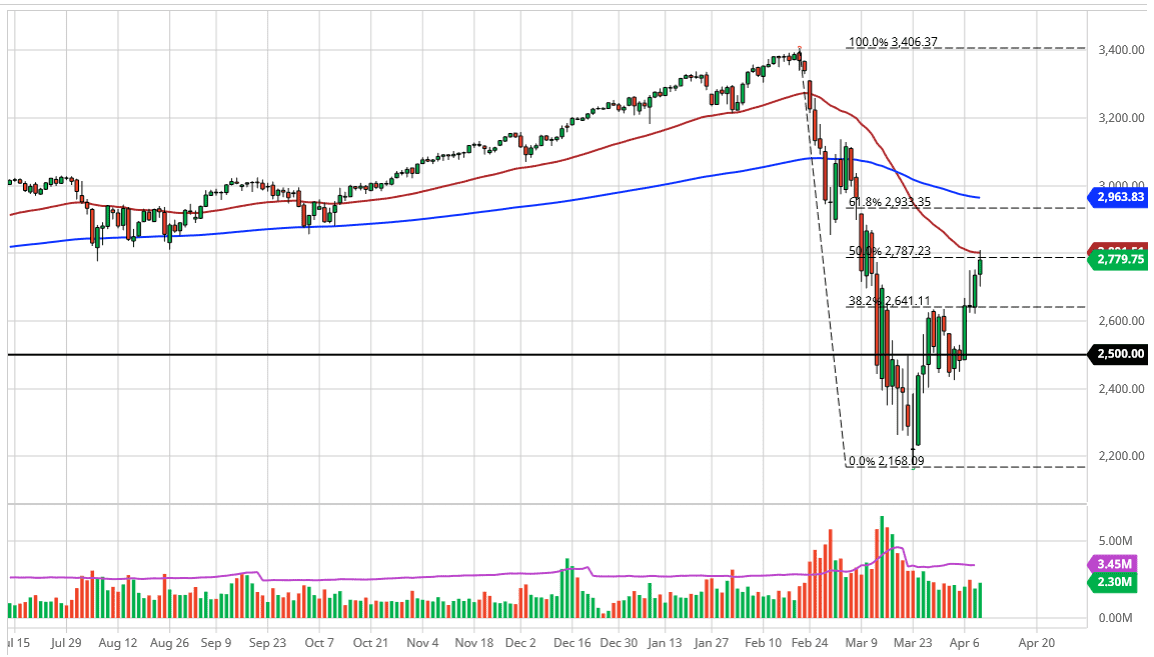
The S&P 500 initially pulled back during the trading session on Thursday, but on Friday was closed as you would anticipate. The E-mini contract being closed of course means that we are looking at the same chart as we were during the previous session, but there is still a lot of technical analysis that you can glean from the chart. It should be noted that Friday did not have any earth shattering type of announcements, that the sentiment should be basically the same as it was previously.
The 50 day EMA sits just above where we close, and it should be noted that we closed basically at the 50% Fibonacci retracement level. In other words, we are at an area that could bring in some selling. We are certainly overextended, and for what it’s worth the NASDAQ 100 has formed a very neutral candlestick. On the other hand, if we break above the high of the trading session for Thursday, then the market is more than likely going to go looking towards the 61.8% Fibonacci retracement level above, where we have seen a previous gap. The 2950 level is in that general vicinity. On the other hand, if the market breaks down below the lows of the trading session on Thursday, then it’s likely we go looking towards the 2650 handle.
One thing is for sure we will continue to see a lot of noise based upon the latest coronavirus headline, and the latest panic driven algorithm move. The question is whether or not the news is going to be good or bad, and then we can make some type of prediction. Until then, algorithms comb Twitter, newsfeeds, and everything else in the world in order to place trades. Keep in mind that this is not an evenly weighted average, so certain companies moving in large amounts can greatly skew what happens.
Looking at this chart, I do think it’s only a matter of time before we pull back, so signs of exhaustion will more than likely lead to the best trading opportunities, but we just don’t have that quite yet as the market has been so bullish over the last couple of weeks. The 200 day EMA is sitting near the 2963 level, and I think that of course will attract a lot of attention on the upside as well.

