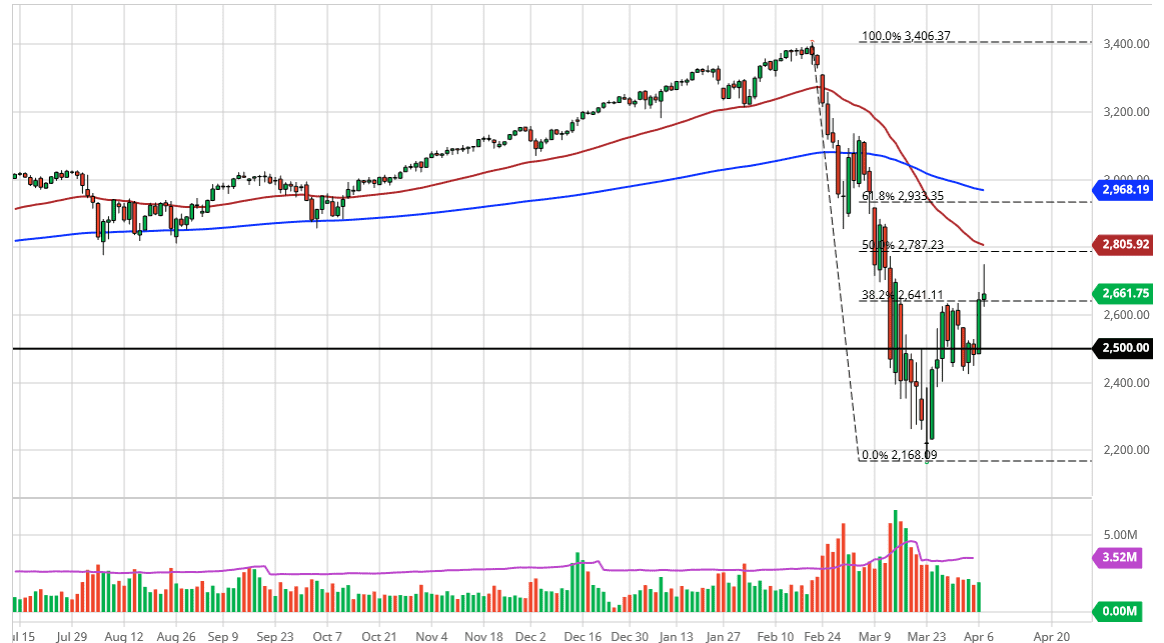
The S&P 500 initially rally during the trading session on Tuesday but did pull back a bit to form a shooting star. If we were to break down below the bottom of the candlestick for the day, then it’s a classic selling signal. The 2500 level underneath will more than likely be the initial target, which should offer plenty of support.
While a lot of analysts believe that the lows are in for this pullback, the reality is that nobody truly knows that. However, it would make sense that we get a pullback so I’m not necessarily looking to short this market and try to break through the bottom. I’m not saying it can’t either, what I am saying is that it is so noisy right now that it’s difficult to extrapolate anything more than a week or two going forward. With that in mind, and the fact that we are getting relatively close to earnings season, I believe that there is going to be a lot of noise. The second quarter in the United States is going to be ridiculous, as far as being so poor.
I believe it best the market is going to be choppy, but I would expect sharp pullbacks from time to time. Even if you are bullish, look at these as buying opportunities as you of course will wish to purchase stocks and indices at lower values. That being said, there is an extraordinarily bearish market case to be made, and if we break down below the 2450 handle, then it’s likely the market goes looking down towards the 2200 level underneath. A breakdown below that level of course opens up a move down to the 2000 handle, which has a significant amount of psychological importance attached to it.
The alternate scenario is that we turn around a break above the top of the shooting star that was formed on Tuesday, putting this market in contention with the 50 day EMA. If we break above that 50 day EMA, then it’s likely that the market will try to break above the 2800 level and go towards the 200 day EMA which is closer to the 2950 level where there is a gap. With this, I think the only thing you can truly count on is a lot of choppiness in this market as well as other stock markets around the world. Be cautious and use a small position size.