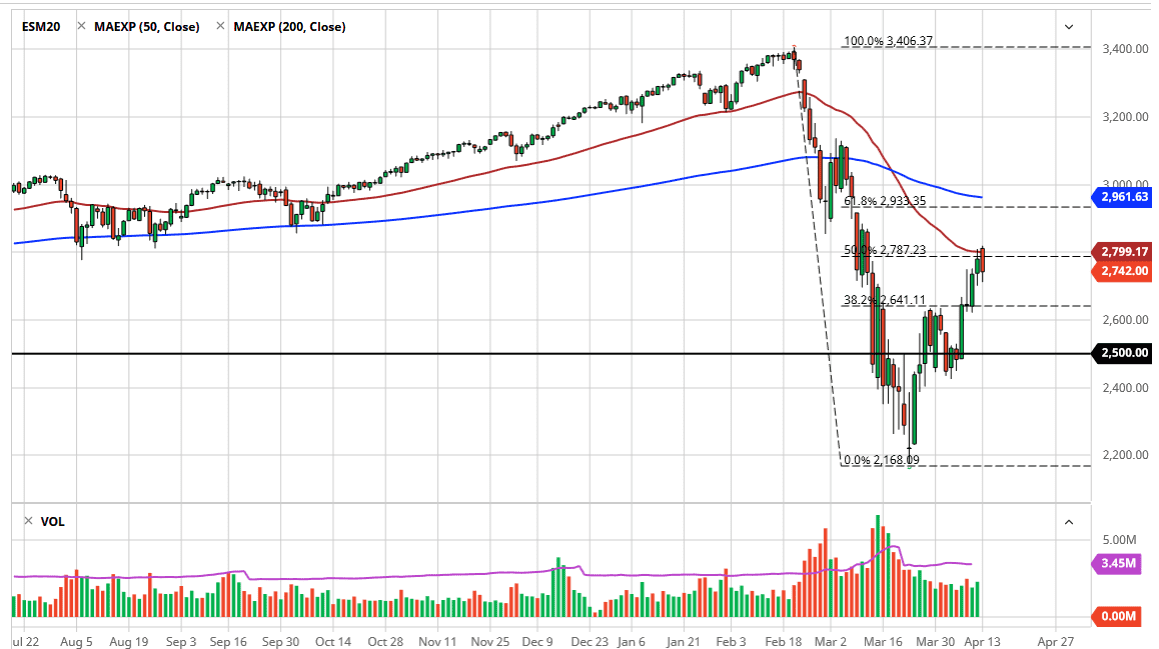
The S&P 500 initially tried to rally during the trading session on Monday as traders came in at bottom of the E-mini contract. However, Europe was essentially close so there was a certain part of the day that was very quiet. As the Americans came on, we started to see the futures market selloff and pull back from the 50 day EMA. That of course is an important technical analysis indicator, but furthermore we also have the 50 day EMA in the same neighborhood so it makes sense that the market would struggle bit in that area.
The 50% Fibonacci retracement level is in the same area as well. Furthermore, it’s also the 2800 level, so really at this point I think there are a multitude of things that could cause some issues for bullish traders out there. It will be interesting to see how this plays out over the next 24 hours now that we see a lot of trouble in this area, and we should see more volume during the day. Beyond that, there is a gap above that could get filled, so that is the bullish case.
The bullish case dictates that we should go to the 200 day EMA which is basically at the 2960 handle. There is a gap in the same area and of course the 61.8% Fibonacci retracement level, so there are a multitude of reasons to think that the market might be attracted to that region. On the other hand, if we break down below the lows of the trading session on Monday, then it’s possible that we go looking towards the 2650 handle, maybe even the 2600 level before opening up a move down to the 2500 level. That’s an area that of course is psychologically and structurally important so a lot of attention will be paid to that.
The one thing that I think you have to be aware of is the latest coronavirus headlines, which of course makes it a very difficult market to trade as it’s all based on emotion and not necessarily based upon economic indicators or the like. I anticipate the volatility is here for a while, and that position sizing will be crucial. Furthermore, I have been getting a lot of emails from people who simply cannot take losses and are short below the 2500 level. There’s nothing you can do at this point other than to decide where your stop loss should go and obey it.