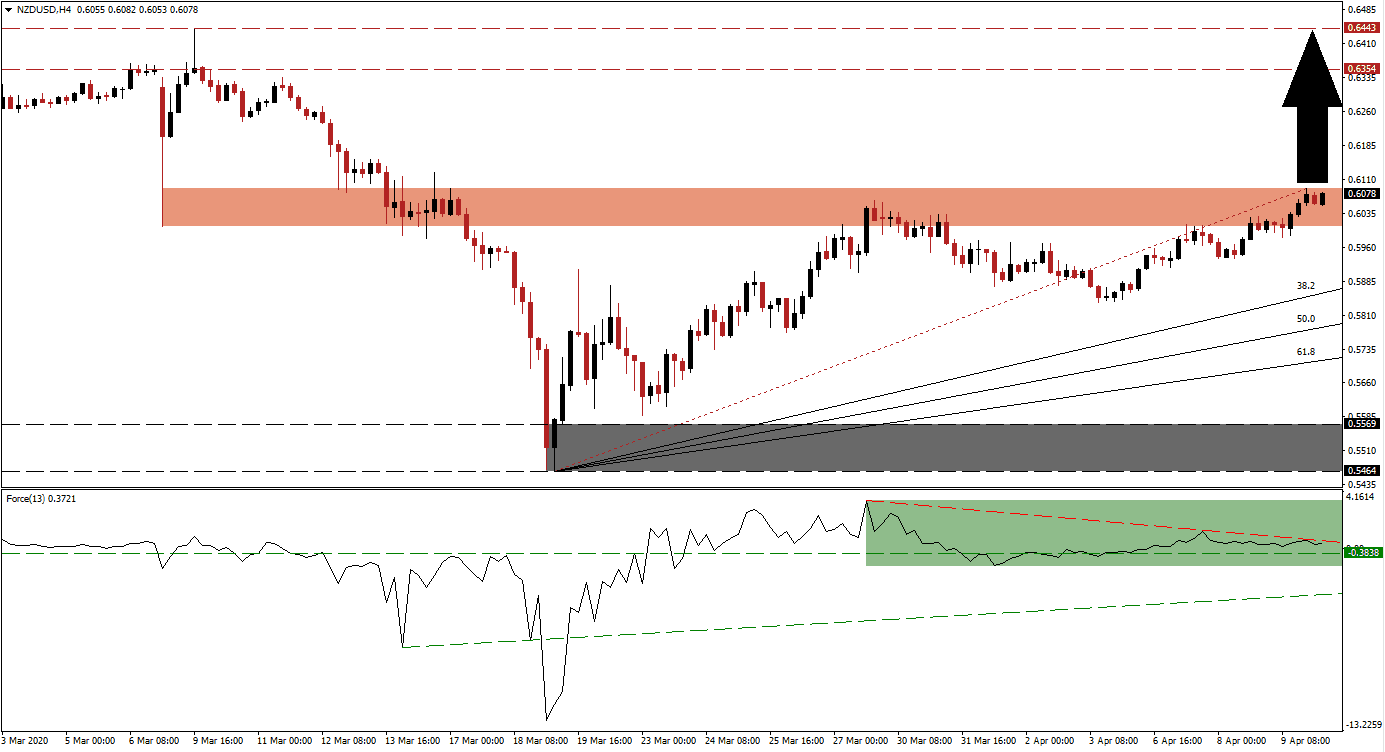
According to the New Zealand Treasury, the forecast second-quarter GDP contraction is likely to be the most severe one on record. It echoes calls by the IMF that the global Covid-19 pandemic will be the most severe crisis since the Great Depression. Yesterday’s US initial jobless claims exceeded expectations for the third week and now amount to approximately 10% of the workforce. The NZD/USD drifted to the top range of its short-term resistance zone, and a higher high, from where a breakout is favored to extend the advance.
The Force Index, a next-generation technical indicator, remains above the 0 center-line and its horizontal support level, granting bulls command of price action in the NZD/USD. Three lower highs created a descending resistance level, as marked by the green rectangle, but a breakout is anticipated on the back of fundamental conditions. The ascending support level is providing a floor under potential short-term contractions. You can learn more about the Force Index here.
A bullish chart pattern emerged after the breakout in the NZD/USD above its support zone located between 0.5464 and 0.5569, as identified by the grey rectangle. The first reversal ended with a higher low, followed by a more distinguished high. It resulted in an upside adjustment to the Fibonacci Retracement Fan sequence to reflect the rise in positive sentiment. New Zealand plans to end the nationwide lockdown on April 20th, but the economic fallout may persist beyond current expectations.
Economic data will be closely monitored once the peak of the pandemic is confirmed. Modifications to the global supply chain are guaranteed to be implemented, creating significant changes across industries. The costs of economic stimulus packages will be priced into markets, creating a bullish bias for the NZD/USD. A breakout above its short-term resistance zone located between 0.6006 and 0.6090 is favored to accelerate price action into its long-term resistance zone between 0.6354 and 0.6443.
NZD/USD Technical Trading Set-Up - Breakout Scenario
Long Entry @ 0.6075
Take Profit @ 0.6440
Stop Loss @ 0.5980
Upside Potential: 365 pips
Downside Risk: 95 pips
Risk/Reward Ratio: 3.84
In case the Force Index sustains a breakdown below its ascending support level, the NZD/USD is likely to enter a minor corrective phase. The downside potential remains limited to the ascending 61.8 Fibonacci Retracement Fan Support Level. New Zealand’s dependence on China positions it to grow out of economic disruptions and transition ahead of the US. Forex traders are advised to consider any sell-off from current levels as a buying opportunity.
NZD/USD Technical Trading Set-Up - Limited Breakdown Scenario
Short Entry @ 0.5875
Take Profit @ 0.5735
Stop Loss @ 0.5935
Downside Potential: 140 pips
Upside Risk: 60 pips
Risk/Reward Ratio: 2.33

