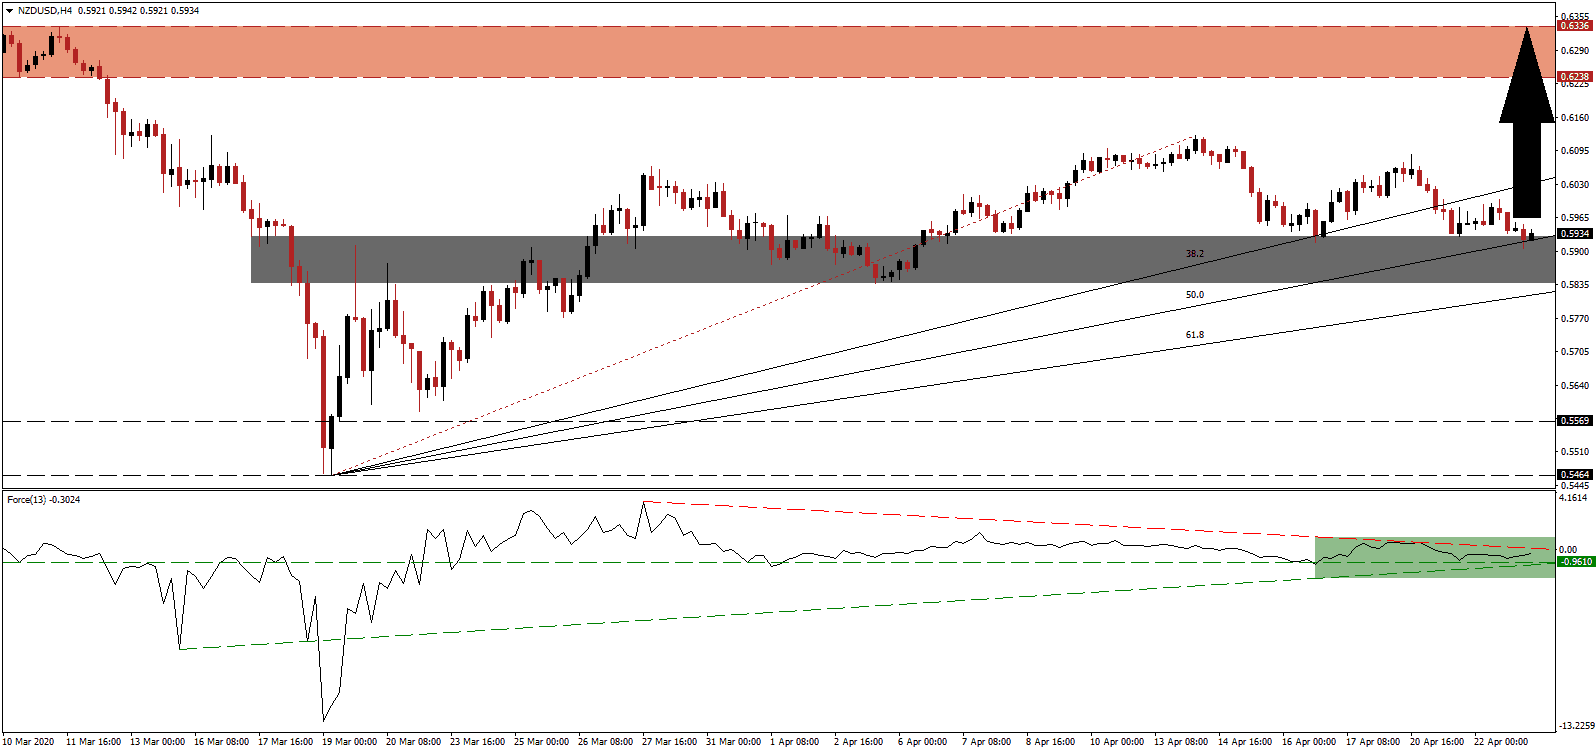
New Zealand’s Prime Minister Ardern announced that the nationwide lockdown contained the Covid-19 outbreak, but that restarting the economy will be delayed and implemented at a slow pace. While many hail the leadership and response of New Zealand, criticism over the measures and costs are equally present. Unemployment is set to spike above 13%, second-quarter GDP may plunge by as much as 33%, and the Reserve Bank of New Zealand initiated an NZ$30 billion quantitative easing program. No clear path to recovery is available, and calls for a US-style cash-payout of NZ$1,500 are on the rise. With mounting issues on the horizon, the US is faced with more severe problems and a fiscally weak position. The NZD/USD is anticipated to bounce higher off of its support zone, extending its advance.
The Force Index, a next-generation technical indicator, maintains its position above the horizontal support level with the ascending support level applying upside pressure, as marked by the green rectangle. The Force Index is favored to move above its descending resistance level and into positive territory. Bulls will regain control of the NZD/USD once this technical indicator crosses above the 0 center-line, likely to provide the initial momentum boost for a resumption of the emerging bullish chart pattern.
After reaching its ascending 50.0 Fibonacci Retracement Fan Support Level, close to exiting the short-term support zone located between 0.5838 and 0.5928, as marked by the grey rectangle, bullish momentum in the NZD/USD started to accumulate. Today’s US initial jobless claims and PMI data for April are likely to deliver the next fundamental catalyst. The risk for a negative surprise remains elevated. New Zealand credit card spending for March plunged, but markets ignored this expected development. You can learn more about the Fibonacci Retracement Fan here.
Forex traders are advised to monitor the intra-day high of 0.6125, which marks the peak of the present breakout sequence, and end-point of the redrawn Fibonacci Retracement Fan sequence. A breakout is favored to attract the next wave of net buy orders, supplying the required volume to spike the NZD/USD into its resistance zone located between 0.6238 and 0.6336, as identified by the red rectangle. More upside is possible, but a new catalyst will be required, while volatility is likely to increase.
NZD/USD Technical Trading Set-Up - Breakout Extension Scenario
Long Entry @ 0.5935
Take Profit @ 0.6335
Stop Loss @ 0.5820
Upside Potential: 400 pips
Downside Risk: 115 pips
Risk/Reward Ratio: 3.48
In the event the descending resistance level will pressure the Force Index into a breakdown, the NZD/USD may enter a minor corrective phase. A collapse below the 61.8 Fibonacci Retracement Fan Support Level will initiate an accelerated sell-off into the long-term support zone located between 0.5464 and 0.5569. Forex traders are advised to consider this an excellent buying opportunity, due to materially worsening conditions out of the US.
NZD/USD Technical Trading Set-Up - Limited Corrective Scenario
Short Entry @ 0.5720
Take Profit @ 0.5520
Stop Loss @ 0.5800
Downside Potential: 200 pips
Upside Risk: 80 pips
Risk/Reward Ratio: 2.50

