


The NASDAQ 100 has rallied significantly during the trading session on Wednesday, reaching towards the 200 day EMA and the 50 day EMA. Ultimately, the market is finding a convergence of resistance in that area, not only due to the moving averages, but the shooting star from the previous session and of course the 50% Fibonacci retracement level. At this point, it looks as if there is a significant amount of resistance just above, so don’t be surprised at all if the market pulls back from here.
That being said, the 8000 level underneath should be relatively supportive, as it was the top of the previous consolidation region. The “market memory principle” suggests that the market will find buyers in that area. However, the market breaks down below the lows of the trading session on Wednesday, the market will probably fall 500 points rather quickly. At this point, there is more than likely going to be a lot of volatility, so keep in mind that the headlines out there will continue to throw this market around.
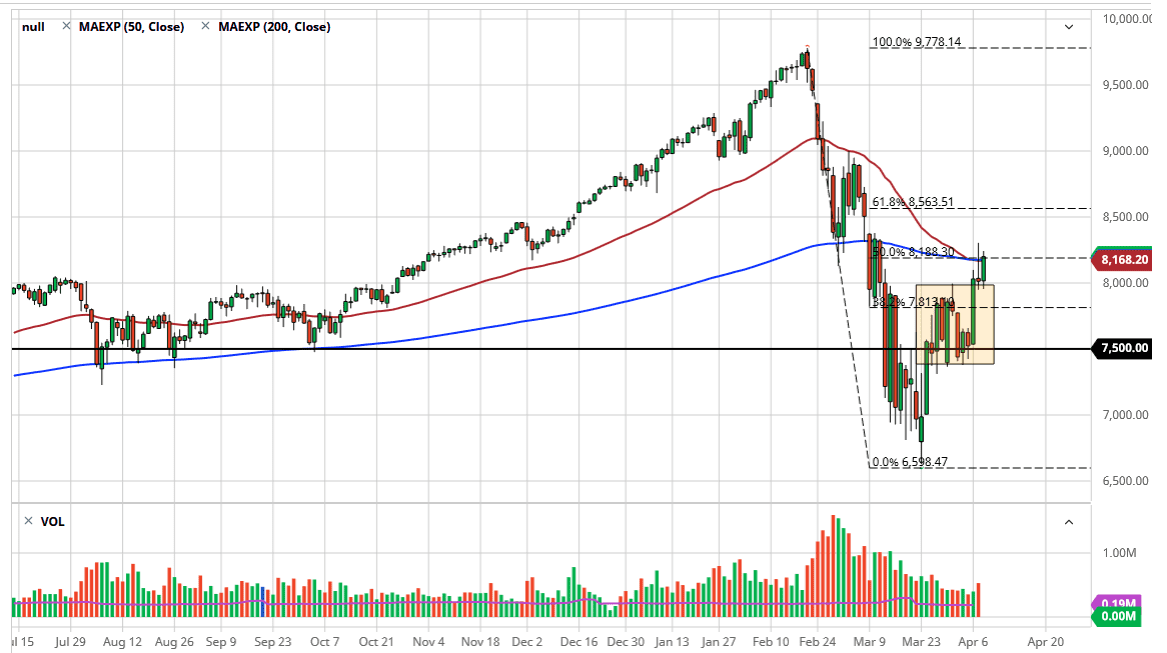
The NASDAQ 100 break above the top of the shooting star from the previous session could send this market much higher, reaching towards the 8500 level which was the scene of a gap. Breaking above there, the market could then open up the possibility of a move to 9000. On the other hand, it’s really going to come down to the latest headline coming out about the coronavirus, but it does look as if the market is trying to figure out what’s going on with the virus. Quite frankly, the market has rallied quite significantly, as the relief rally has been substantial. Over the next couple of days, we should get a little bit more clarity, because if the 50% Fibonacci retracement level does in fact offer an enough resistance, the market could very well turn right back around and drop. The next couple of candles should be rather important to keep an eye on that and the weekly candlestick will also be crucial. Ultimately, position sizing will be crucial, but if we do make a move on either side of the shooting star from the previous session, that could give you an idea as to where we go next. Expect a lot of noise, but we are getting ready to make a significant move in this market, as the market is trying to wind up and build inertia.