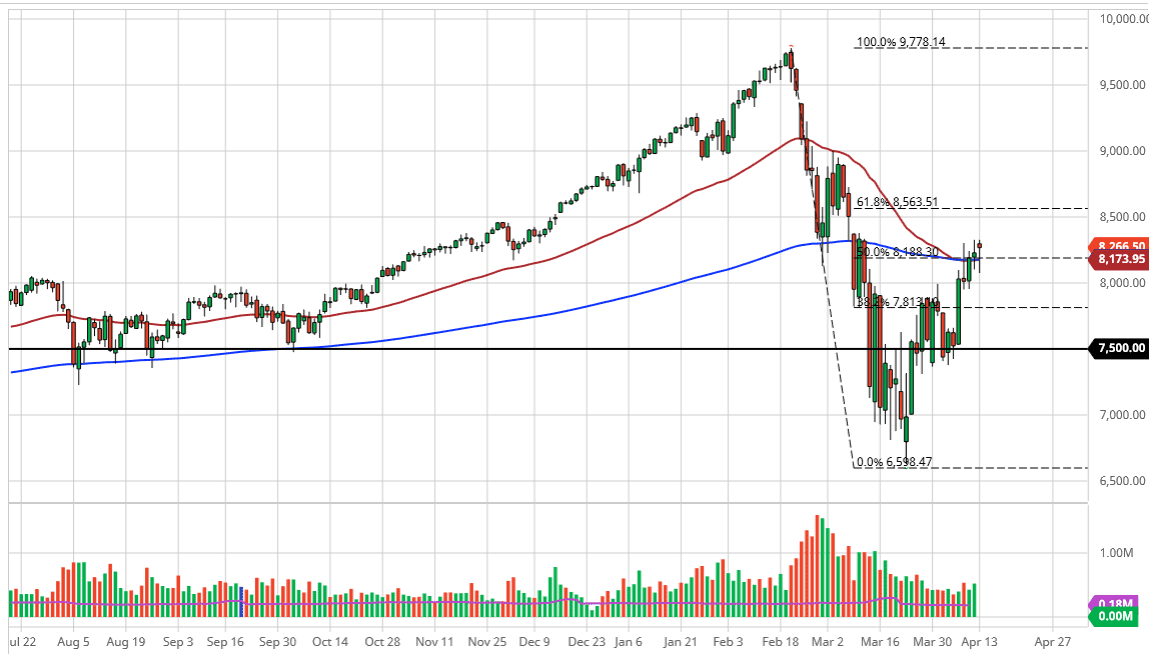
The NASDAQ 100 gapped higher to kick off the week, pull back below the 50 and the 200 day EMA indicators during the session, only to turn around and rally again. This suggests that the market is trying to break out to the upside so if we clear the highs of the trading session of both Thursday and Monday, then the market is likely to go higher, reaching towards 8500 level as it will not only be the large, round, psychologically significant figure that people like, but it is also the 61.8% Fibonacci retracement level in the scene of a gap.
The NASDAQ 100 does lead the way going forward most of the time, so this could be a bit of an indicator for the S&P 500 and the Dow Jones Industrial Average markets as well. Tech seems to lead the way most of the time, so be aware of that could be the case here as well. For what it’s worth, the candlestick is rather bullish looking so I do lean a little bit more to the upside right now but if we were to turn around and breakdown below the candlestick for the trading session on Monday, that would make it a “hanging man”, which is a very negative candlestick. At that point, one would have to think that the market is going to go looking towards the 8000 level, and then eventually the 7500 level where I see an absolute ton of support based upon the most recent surge higher.
Keep in mind that we are approaching earnings season and quite frankly most of the earnings will have come from technology stocks that specialize in teleconferencing and the like. With that in mind, the NASDAQ 100 will probably continue to be a bit of a media darling, thereby attracting a lot of attention. If we do break above the 61.8% Fibonacci retracement level, roughly the 8050 level, then the market is free to go to the 9000 handle, and then eventually the all-time highs again. That being said though, I don’t think we are going to see that happen quite so easily. A pullback makes quite a bit of sense, but the candlestick for the session doesn’t suggest that it’s coming immediately. Unfortunately, we continue to move on the sentiment of the day, and therefore the conditions are going to continue to be very difficult.