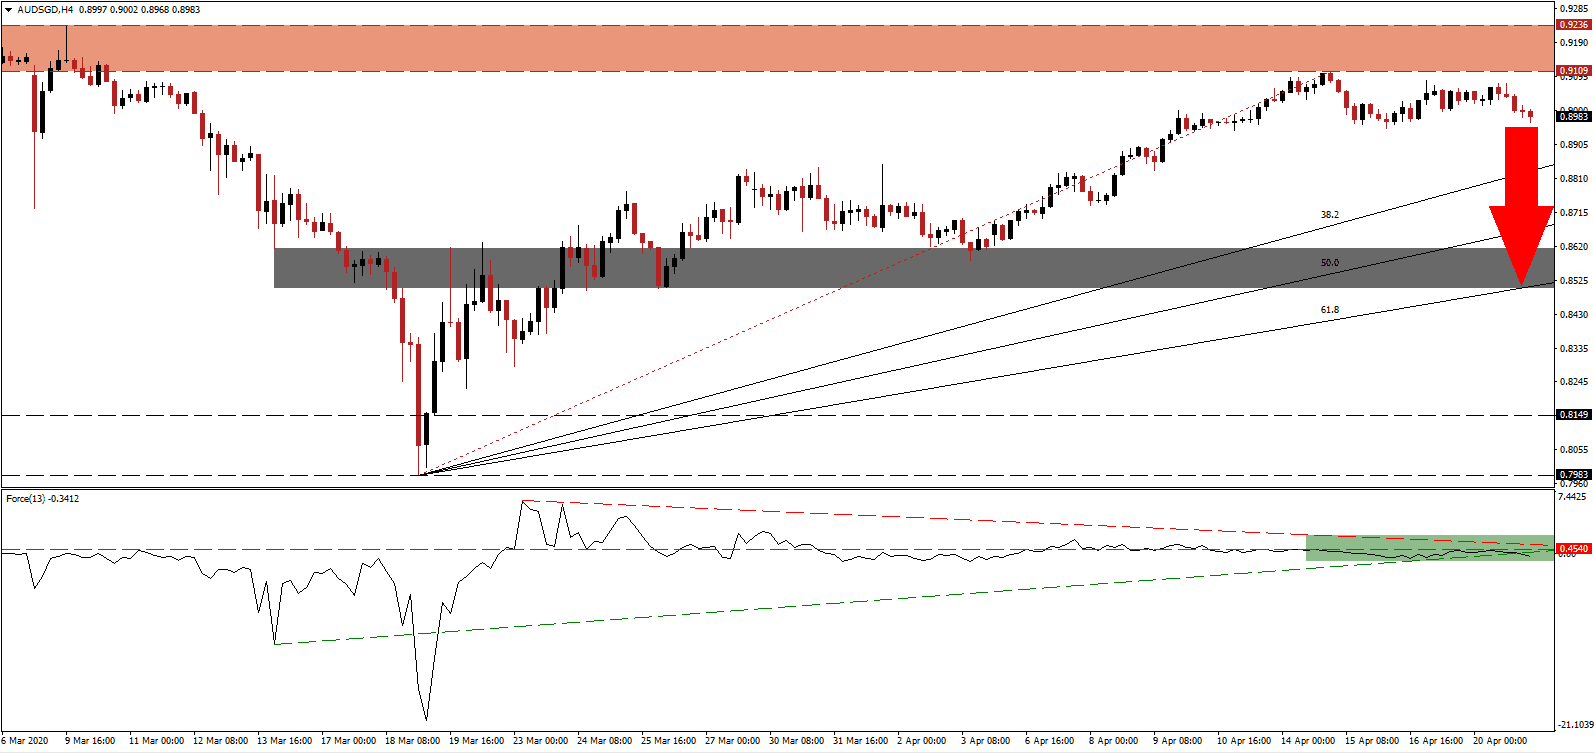
Singapore reported a 17.6% rise in March non-crude exports on the back of a 242.5% surge in gold shipments and a 48.6 advance in pharmaceuticals. Economists predicted a contraction of 8.9%, while the gold-driven demand highlights an elevated desire for safe-haven assets. The Covid-19 pandemic forced a debate in Singapore concerning the 1.4 million migrant workers powering key industries. It is the latest example of potential long-term changes to existing economic models. The AUD/SGD was rejected by its resistance zone and is well-positioned for a more massive sell-off.
The Force Index, a next-generation technical indicator, points towards the increase in bearish momentum. Following the rejection, it detached from its horizontal resistance level and corrected below its ascending support level, as marked by the green rectangle. Adding to downside pressures is its descending resistance level. This technical indicator also moved into negative territory, ceding control of the AUD/SGD to bears. You can learn more about the Force Index here.
With global Covid-19 cases approaching 2.5 million, the costs of government stimuli are slowly entering the debate. Trillions of dollars were borrowed to bridge nationwide lockdowns, which placed many economies in hibernation. Australia and Singapore have relatively low debt loads, adding a fundamental catalyst to both. Singapore additionally benefits from its cash reserves, which partially fund its response to the virus. After the resistance zone located between 0.9109 and 0.9236, as marked by the red rectangle, forced the AUD/SGD into a reversal, short-term breakdown pressures have magnified.
Price action is anticipated to collapse below its ascending 38.2 Fibonacci Retracement Fan Support Level, generating the necessary volume for an accelerated corrective phase. The next short-term support zone awaits the AUD/SGD between 0.8505 and 0.8616, as identified by the grey rectangle. It is enforced by the 61.8 Fibonacci Retracement Fan Support Level. A breakdown below the current low if the reversal, marked by the intra-day low of 0.8949, is favored to result in the addition of new net sell orders in this currency pair, sparking the pending sell-off.
AUD/SGD Technical Trading Set-Up - Breakdown Scenario
Short Entry @ 0.8985
Take Profit @ 0.8510
Stop Loss @ 0.9135
Downside Potential: 475 pips
Upside Risk: 150 pips
Risk/Reward Ratio: 3.17
In case the Force Index completes a breakout above its descending resistance level, the AUD/SGD is likely to attempt one of its own. The next resistance zone is located between 0.9337 and 0.9361, which Forex traders should view as an excellent buying opportunity. Singapore’s fiscal position provides it with a strategic advantage over Australia, and therefore a bearish bias for this currency pair.
AUD/SGD Technical Trading Set-Up - Limited Breakout Scenario
Long Entry @ 0.9260
Take Profit @ 0.9360
Stop Loss @ 0.9210
Upside Potential: 100 pips
Downside Risk: 50 pips
Risk/Reward Ratio: 2.00

