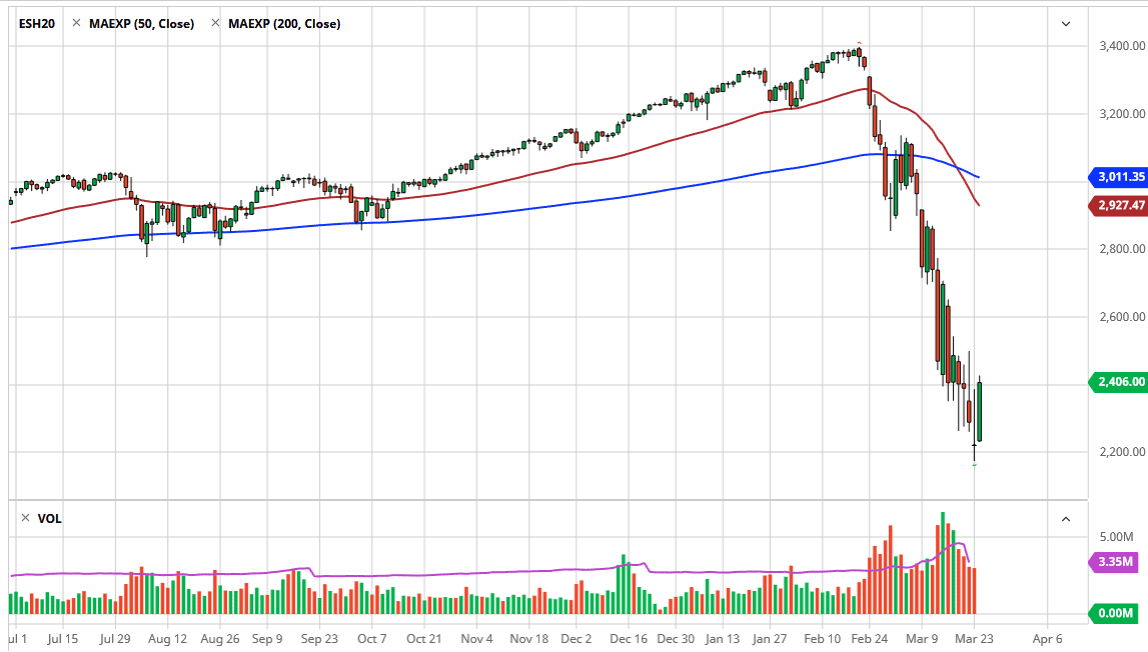
The S&P 500 has formed a very bullish candlestick during the trading session on Tuesday, breaking above the top of the candlestick from the previous session. By breaking the top of the inverted hammer from the previous session, this suggests that the market is getting ready to try to break to the upside. However, there is a lot of resistance all the way to the 2500 level above. If we can break above that level, then I think the S&P 500 can really start to take off to the upside.
Pullbacks at this point should end up being buying opportunities, because quite frankly it’s likely that the 2200 level will offer a significant amount of support. The market will continue to see a lot of volatility obviously, but it should be noted that we are at extreme lows based upon the recent selloff, and a relief rally seems to be coming sooner rather than later.
Looking at the size of the candlestick for the trading session, that is obviously a very bullish sign. I think at this point, one would have to think that there could be a little bit of follow-through but even if we get a pull back from here, I believe that there will be plenty of buyers underneath or at least people willing to jump in and try to find value. I think it’s very difficult to get short at this point, if just simply because the market has sold off so drastically.
At this point, I believe that every 100 points or so we are going to see a significant amount of resistance but if we get a proper stimulus bill it’s possible that Wall Street will celebrate by pushing this market higher in an extraordinarily bullish move. I don’t necessarily think that will be the end of the turmoil, because typically you will see some type of pullback to find whether or not the support underneath will hold after a bear market rally. If it does, then quite often you will see an uptrend form. However, if we turn around and breakdown below the 2200 level, we could open up the door down to the 2100 level, which is important on the longer-term charts. I believe that begins to see the 100 points worth of support that extends down to the 2000 handle. Overall, I do believe that we are closer to the end of the selling than the beginning.

