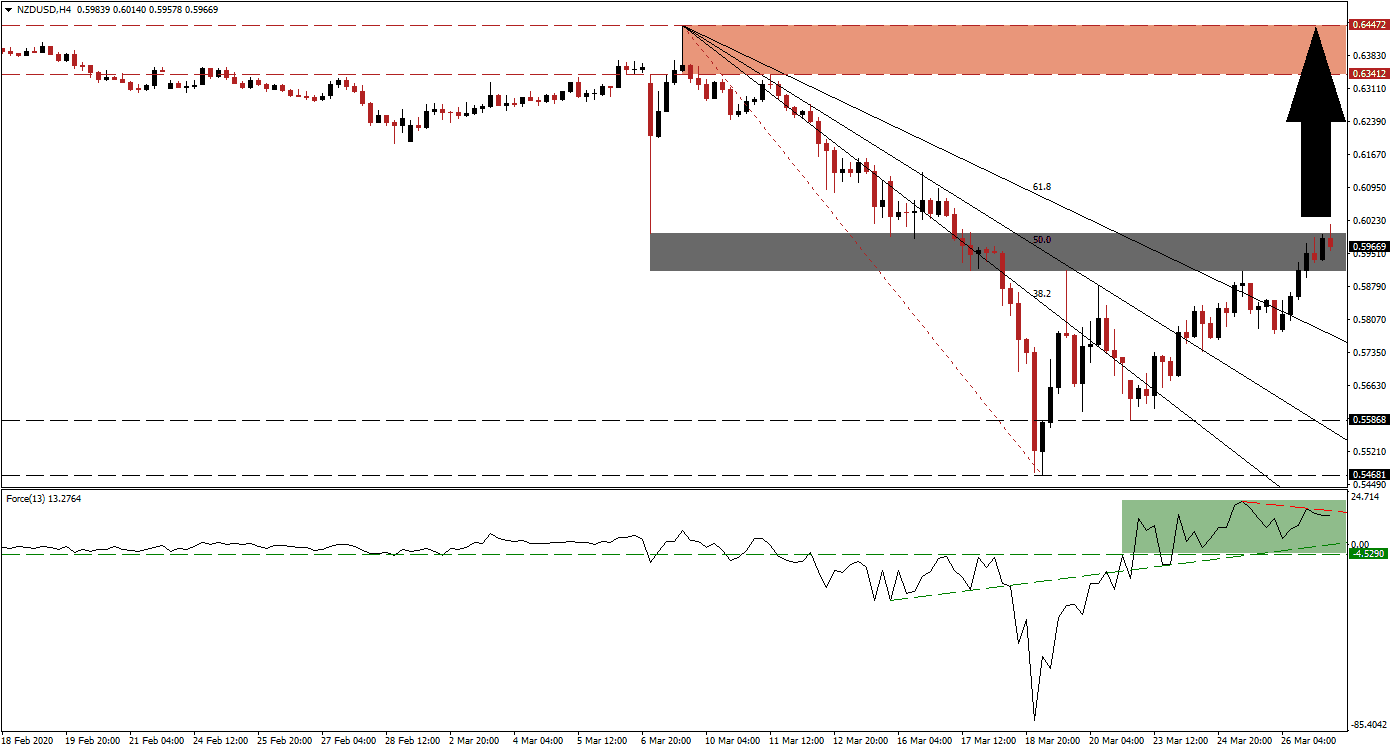
Covid-19 cases in the US have surpassed those in China. President Trump has vowed to force the economy open by April 12th, against the advice of medical experts. The US reported a record 3.283 million initial jobless claims yesterday, dwarfing data from the Great Depression and the 2008 global financial crisis. Reports noted the actual number is significantly higher, but not all unemployed were able to file due to lack of capacity. The NZD/USD turned its short-term resistance zone into support, from where an imminent breakout will extend the price action recovery.
The Force Index, a next-generation technical indicator, initially collapsed to a new multi-year low before reclaiming its ascending support level. It then converted its horizontal resistance level into support, as marked by the green rectangle. This technical indicator crossed above the 0 center-line, granting bulls control of the NZD/USD. More upside is favored following a breakout above its descending resistance level. You can learn more about the Force Index here.
US Dollar weakness is starting to emerge on the back of an extreme oversupply of the currency. The US Federal Reserve slashed interest rates to zero and is flooding the financial system with supply. While a rush to liquid assets provided a short-term boost, the US Dollar is now under selling pressure. After accelerating out of its long-term support zone, the NZD/USD pushed through the entire Fibonacci Retracement Fan sequence. Price action is now awaiting a breakout catalyst inside of its converted short-term support zone, located between 0.59114 and 0.59943, as marked by the grey rectangle.
New Zealand is entering a nationwide lockdown to contain the spread of Covid-19. The only proven solution to combat the virus to-date has been social distancing and nationwide quarantines. Reluctance by the US to impose the most extreme measures places its recovery behind the curve of New Zealand, which is dependent on China’s economy and provides a long-term fundamental catalyst. A breakout will clear the path for the NZD/USD to advance into is resistance zone, which awaits between 0.63412 and 0.64472, as identified by the red rectangle. You can learn more about a breakout here.
NZD/USD Technical Trading Set-Up - Breakout Extension Scenario
Long Entry @ 0.59650
Take Profit @ 0.64450
Stop Loss @ 0.58350
Upside Potential: 480 pips
Downside Risk: 130 pips
Risk/Reward Ratio: 3.69
In the event of a contraction in the Force Index, initiated by its descending resistance level, the NZD/USD is likely to attempt a breakdown. The downside is limited to its descending 50.0 Fibonacci Retracement Fan Support Level. It is currently passing through the long-term support zone located between 0.54681 and 0.55868. Forex traders are advised to consider any breakdown as an excellent buying opportunity.
NZD/USD Technical Trading Set-Up - Limited Breakdown Scenario
Short Entry @ 0.57250
Take Profit @ 0.55500
Stop Loss @ 0.58000
Downside Potential: 175 pips
Upside Risk: 75 pips
Risk/Reward Ratio: 2.33

