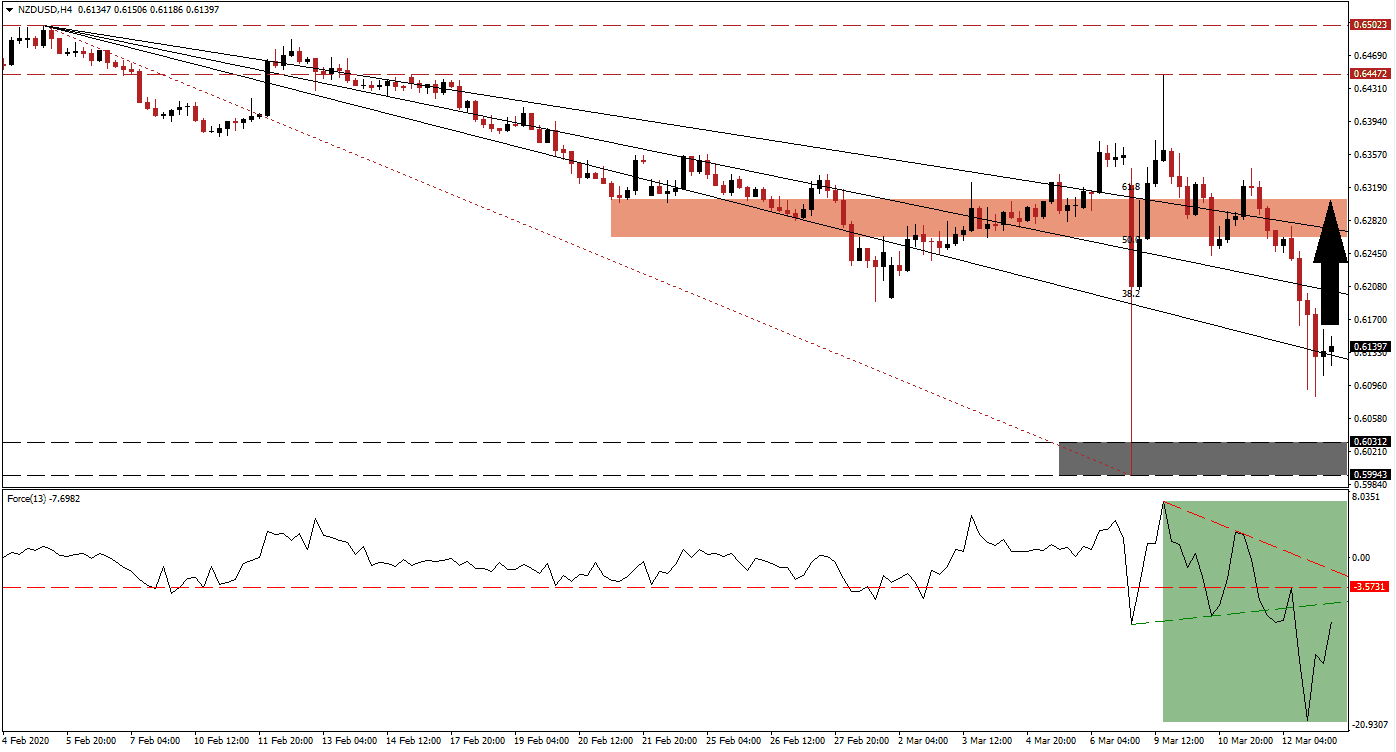
Liquidity started to become an issue across the global financial system, and the US Dollar rallied despite the US Federal Reserve’s panic-cut of 50 basis points. The advance may be short-lived as the US central bank is pressured to deliver a 75 basis point interest cut this month. It announced $1 trillion in liquidity yesterday, in a failed attempt to calm markets. The NZD/USD plunged into its support zone, dating back to January 2009 before recovering above its descending 38.2 Fibonacci Retracement Fan Support Level.
The Force Index, a next-generation technical indicator, followed price action to the downside and is now amid a reversal off of a new 2020 low. A push above its ascending support level, acting as short-term resistance as marked by the green rectangle, is expected to convert its horizontal resistance level back into support. The descending resistance level will pose a significant challenge from where a breakout will spike this technical indicator into positive territory, granting bulls control of the NZD/USD. You can learn more about the Force Index here.
While a renewed push in this currency pair into its support zone located between 0.59943 and 0.60312, as marked by the grey rectangle, cannot be ruled out, the NZD/USD is developing a mild bullish bias. Stability above its 38.2 Fibonacci Retracement Fan Support Level is anticipated to initiate a short-covering rally, boosted by fundamental conditions. The New Zealand economy is heavily dependent on China, which appears to be past its Covid-19 peak and on a slow path to normalization.
An advance from current levels is anticipated to take the NZD/USD into its short-term resistance zone located between 0.62633 and 0.63060, as marked by the red rectangle. The 61.8 Fibonacci Retracement Fan Resistance Level is passing through this zone. A breakout above it will end the bearish chart formation, but more upside will require a fresh catalyst. With the return of quantitative easing by the US Federal Reserve, this currency pair will face long-term upside pressure. You can learn more about a breakout here.
NZD/USD Technical Trading Set-Up - Short-Covering Scenario
Long Entry @ 0.61400
Take Profit @ 0.63000
Stop Loss @ 0.60900
Upside Potential: 160 pips
Downside Risk: 50 pips
Risk/Reward Ratio: 3.20
In case of rejection in the Force Index by its descending resistance level, the NZD/USD is likely to attempt a second push into its support zone. Given the developing fundamental conditions, enforced by technical progress, a breakdown appears unlikely unless a major development unfolds. Forex traders are advised to cautiously consider any sell-off from current levels as a good buying opportunity.
NZD/USD Technical Trading Set-Up - Limited Breakdown Scenario
Short Entry @ 0.60600
Take Profit @ 0.60000
Stop Loss @ 0.60900
Downside Potential: 60 pips
Upside Risk: 30 pips
Risk/Reward Ratio: 2.00

