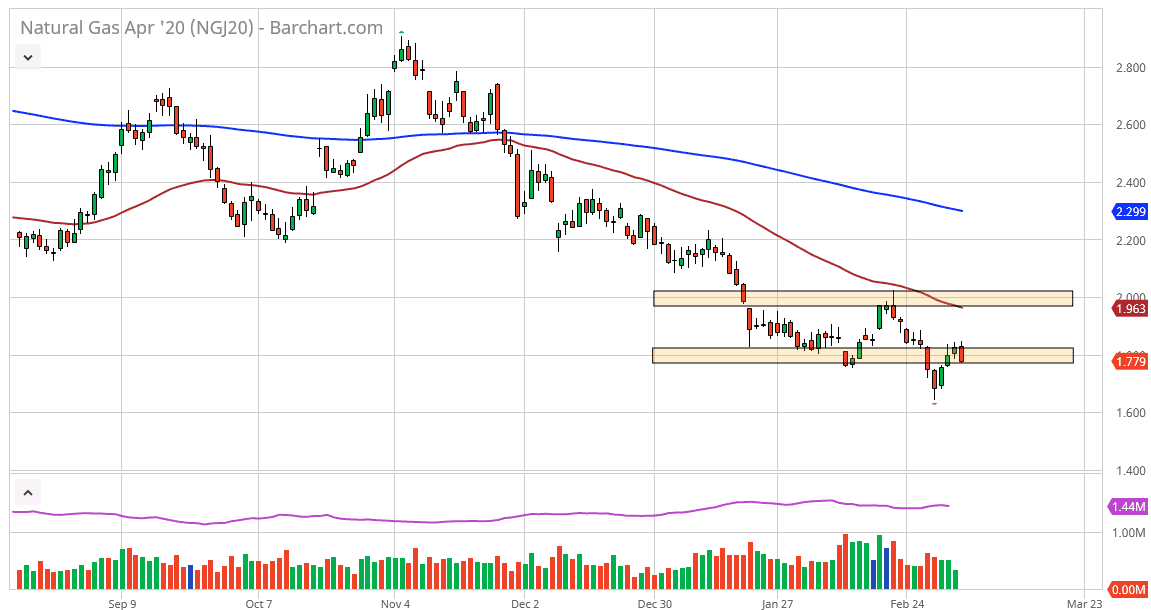
The natural gas markets initially tried to rally during the trading session on Thursday, but then has broken down yet again. In fact, the market has broken down below the $1.80 level as well. By closing at the bottom of the candlestick for the daily trading session it suggests that the natural gas markets have further to fall. This is a market that I think is going to test the lows again after the less than impressive inventory figures on Thursday.
At this point, it does look like we are ready to rollover in this market yet again as demand for natural gas will naturally decline this time of year. Furthermore, the jobs number is rather bleak it could suggest that industrial demand will be dropping also. The one thing that has been a bright spot in the US economy has been the employment situation, and as long as that remain strong it’s very likely that the natural gas markets will continue to see some demand, but with the temperatures rising due to the winter ending, it makes sense that the market will continue to see less and less buyers.
Hourly chart looks bleak
The hourly chart shows that we are breaking down yet again as the 50 hour EMA has bounced into the 200 hour EMA before pulling back. I think at this point it’s likely that we will see the market test the $1.75 level, and then possibly the $1.70 level during the Friday session. Rallies at this juncture should see plenty of sellers near the $1.81 level as it is the confluence of the two major moving averages and an area where we have seen a lot of noise. In fact, I wouldn’t be impressed until we break above the $1.85 level, and even then, I think it would just tell traders to stand on the sidelines and wait for a selling opportunity at an even higher level. The $1.65 level for me is significant support in the short term, and I think it extends down to the $1.60 level. As the market rolls over, short-term trading opportunities present themselves, but as far as hanging onto the natural gas markets for any significant amount of time, it’s probably almost impossible to do so as the volatility will continue to be very strong. Eventually we will get bankruptcies in the industry driving price higher, but right now we are nowhere near doing that.

