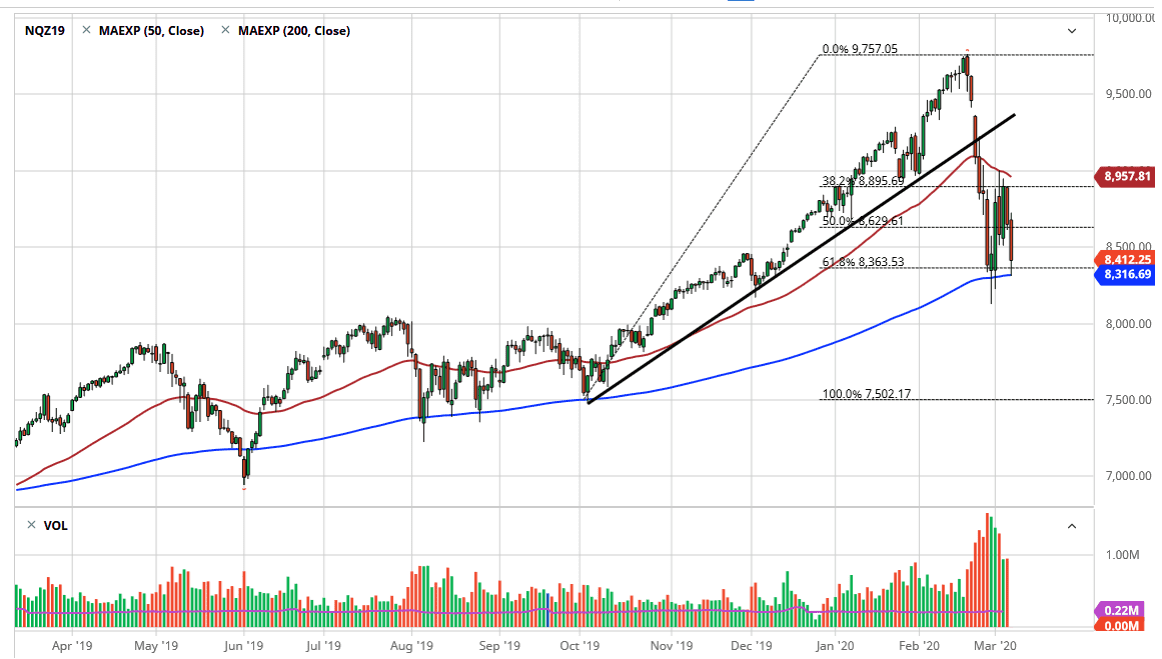
The NASDAQ 100 broke down a bit during the trading session on Friday, reaching down towards the 200 day EMA before bouncing slightly. The jobs number in the United States of course was better than anticipated, and that put a little bit of a bullish tone into risk appetite for a moment, but at the end of the day we still see a lot of negativity out there as the markets come to grips with the idea that the Federal Reserve had to cut 50 basis points in an emergency statement. That almost always means that the Federal Reserve sees something it doesn’t lie, and as a result it’s very unlikely that the markets feel comfortable with that. Furthermore, it’s likely that the underlying issues that have been pushing the markets around will continue to be a major problem.
At this point in time, the 200 day EMA has held several attempts to break down below it, but it certainly looks as if we are starting to roll over a bit. If that’s going to be the case, it’s likely that we will see an attempt to break down below the most recent lows. The alternate scenario of course is that we go sideways and try to build up a little bit of pressure in this area, but it is starting to look a lot like a bearish flag pattern. If that happens, we could be looking at a move down towards the 7000 level based upon the measurement. I’m not quite ready to call it that yet, but it seems to be that we are likely to at least attempt to break down a bit further.
I would say that the bullish scenario is sideways action between the 200 day EMA on the bottom and the 50 day EMA at the top, as a breakout above the 50 day EMA seems to be very unlikely based upon the volatility that we have seen. Markets don’t like this type of volatility; it becomes far too difficult to handle. When things get this volatile, markets fall as most traders don’t like the idea of this kind of risk. All things being equal, I believe that shorting the market on small pops to the upside is probably how most traders are looking to advance. We will eventually see a longer-term “buy-and-hold” scenario, but we aren’t there quite yet.

