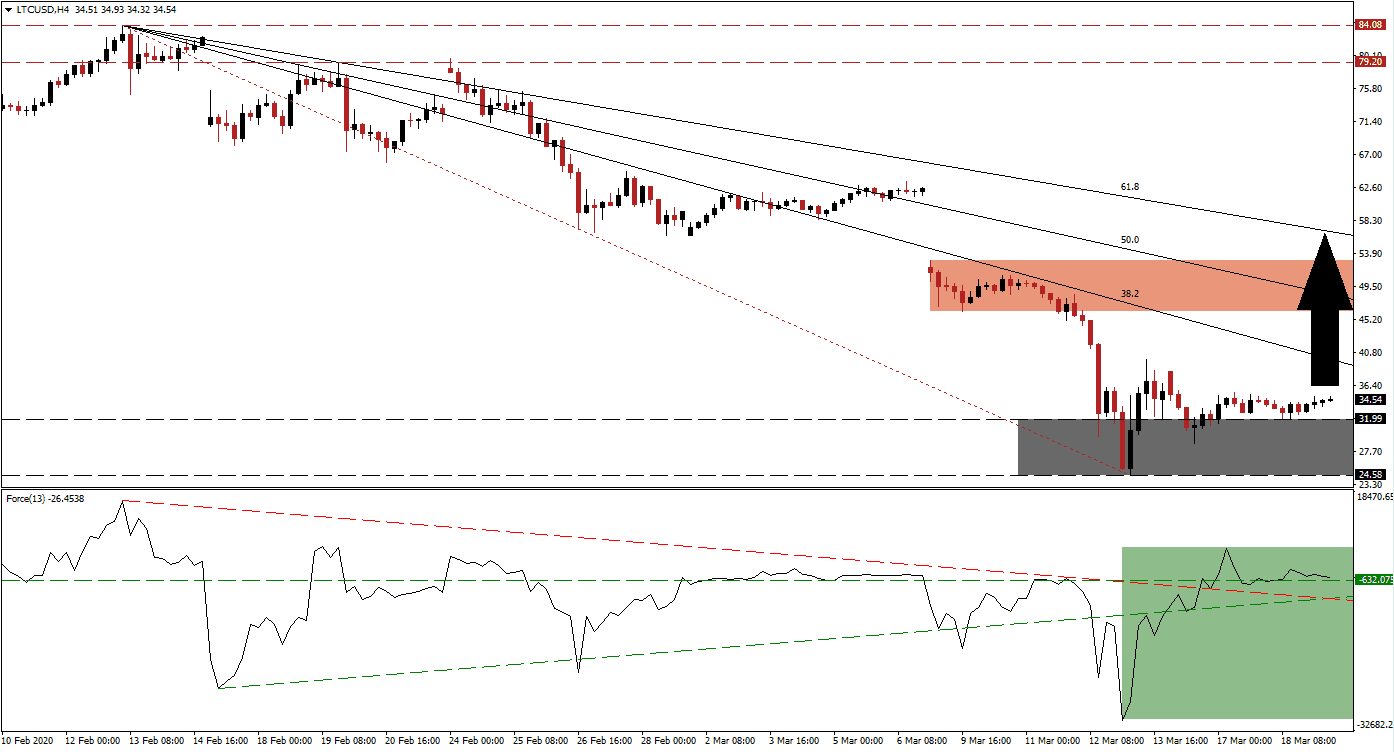
While the cryptocurrency market remains under stress due to the outflow of institutional capital, the LTC/USD presents patient traders with an excellent opportunity. Cryptocurrency mining after the price collapse has become unprofitable, forcing smaller miners to shut down. The drop in the hashrate, or mining capacity, results in more downside pressure on price action. Litecoin has a protocol in place to increase the mining difficulty and rewards in the event of a drop in its hashrate, granting miners an incentive to return to the network. This cryptocurrency pair completed a breakout above its support zone with more upside potential amid the bullish momentum recovery.
The Force Index, a next-generation technical indicator, initially plunged to a new 2020 low before embarking on a sharp reversal. After reclaiming its ascending support level, bullish momentum carried the Force Index above its descending resistance level. It was followed by a conversion of its horizontal resistance level into support, as marked by the green rectangle. This technical indicator is now favored to advance above the 0 center-line, ceding control of the LTC/USD to bulls. You can learn more about the Force Index here.
Margin calls related to the collapse across the financial system forced institutional selling in non-core assets like the cryptocurrency market. The bulk of selling pressure passed, but depending on global equity markets, numerous assets may face extended bearish conditions. Bitcoin and Ethereum carry the most significant downside risk. The LTC/USD has a host of positive fundamental developments favored to ignite a price action recovery. After price action pushed out of its support zone located between 24.58 and 31.99, as marked by the grey rectangle, more upside is expected.
One essential level to monitor is the intra-day high of 39.91, the peak of the current breakout. A sustained push higher will elevate the LTC/USD above its descending 38.2 Fibonacci Retracement Fan Resistance Level, leading to the addition of new net buy orders. It should suffice to pressure this cryptocurrency pair into its short-term resistance zone located between 46.24 and 52.94, as marked by the red rectangle. The top range represents the bottom of a previous price gap to the downside, and a push into its 61.8 Fibonacci Retracement Fan Resistance Level is possible.
LTC/USD Technical Trading Set-Up - Breakout Extension Scenario
Long Entry @ 34.60
Take Profit @ 56.60
Stop Loss @ 28.60
Upside Potential: 2,200 pips
Downside Risk: 600 pips
Risk/Reward Ratio: 3.67
A collapse in the Force Index below its ascending support level will likely result in a renewed contraction in the LTC/USD. Traders are advised to consider any breakdown below its existing support zone as an outstanding buying opportunity. The fundamental outlook for this cryptocurrency pair carries a distinct bullish bias, while a sustained extension of the corrective phase remains unlikely. The next support zone is located between 15.56 and 20.34, dating back to April 2017.
LTC/USD Technical Trading Set-Up - Limited Breakdown Scenario
Short Entry @ 24.00
Take Profit @ 16.00
Stop Loss @ 28.00
Downside Potential: 800 pips
Upside Risk: 400 pips
Risk/Reward Ratio: 2.00

