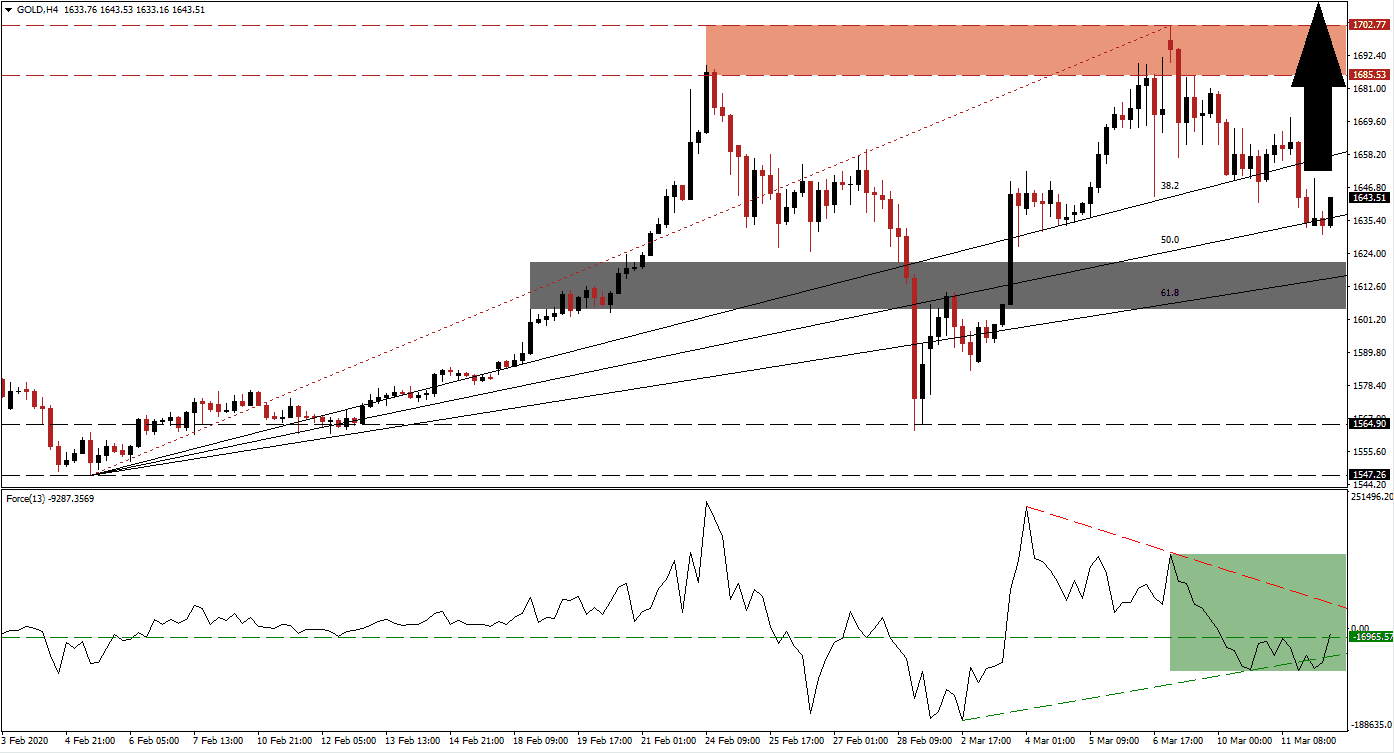
Following a sell-off in this precious metal, related to immediate cash requirements by a growing number of portfolio managers to meet margin calls, price action maintained its bullish chart pattern. The long-term trend favors an extension of the rally to new 2020 highs, but forced gold-selling will accompany the advance. Central banks started to slash interest rates with the US Federal Reserve pressured to deliver more. It weakens the US Dollar, providing a catalyst for gold, which is priced in the US currency. The ascending 50.0 Fibonacci Retracement Fan Support Level is enforcing the dominant uptrend. Volatility remains elevated as the global economy is faced with multiple challenges.
The Force Index, a next-generation technical indicator, confirmed healthy bullish pressures after recording a higher low. It resulted in the formation of an ascending support level, which allowed the Force Index to recover above its horizontal resistance level, converting it into support, as marked by the green rectangle. This technical indicator is positioned to accelerate into positive territory and above its descending resistance level, placing bulls in charge of gold.
Due to existing fundamental drivers, suggesting more upside in this precious metal, the short-term support zone will be moved higher after the current advance off of the 50.0 Fibonacci Retracement Fan Support Level is confirmed. This zone is currently located between 1,604.82 and 1,626.42, as marked by the grey rectangle, enforced by its 61.8Fibonacci Retracement Fan Support Level. With economic disruptions set to worsen, gold is well-positioned to push higher. Central banks have been a significant buyer of the world’s primary safe-haven asset.
Inflationary pressures have increased and may spike as central banks lower interest rates. It adds to bullish pressures in this precious metal. One critical level to monitor is the intra-day high of 1,652.25, the peak of a previous pause before gold spiked to its current 2020 high. A breakout is expected to initiate the next wave of net buy orders, pushing price action into its resistance zone located between 1,685.53 and 1,702.77, as marked by the red rectangle. An extension of the advance is anticipated to extend the rally into its next resistance zone between 1,772.52 and 1,795.25, dating back to September 2012. You can learn more about a breakout here.
Gold Technical Trading Set-Up - Breakout Extension Scenario
Long Entry @ 1,643.00
Take Profit @ 1,795.00
Stop Loss @ 1,615.00
Upside Potential: 15,200 pips
Downside Risk: 2,800 pips
Risk/Reward Ratio: 5.43
Should the Force Index reverse below its ascending support level, gold could be pressured to the downside. Any contraction from current levels should be considered an outstanding long-term buying opportunity. The downside potential following a breakdown below its short-term support zone remains limited to its long-term support zone located between 1,547.26 and 1,564.90, with the top range favored to reignite the bullish trend.
Gold Technical Trading Set-Up - Limited Breakdown Scenario
Short Entry @ 1,592.00
Take Profit @ 1,564.00
Stop Loss @ 1,605.00
Downside Potential: 2,800 pips
Upside Risk: 1,300 pips
Risk/Reward Ratio: 2.15

