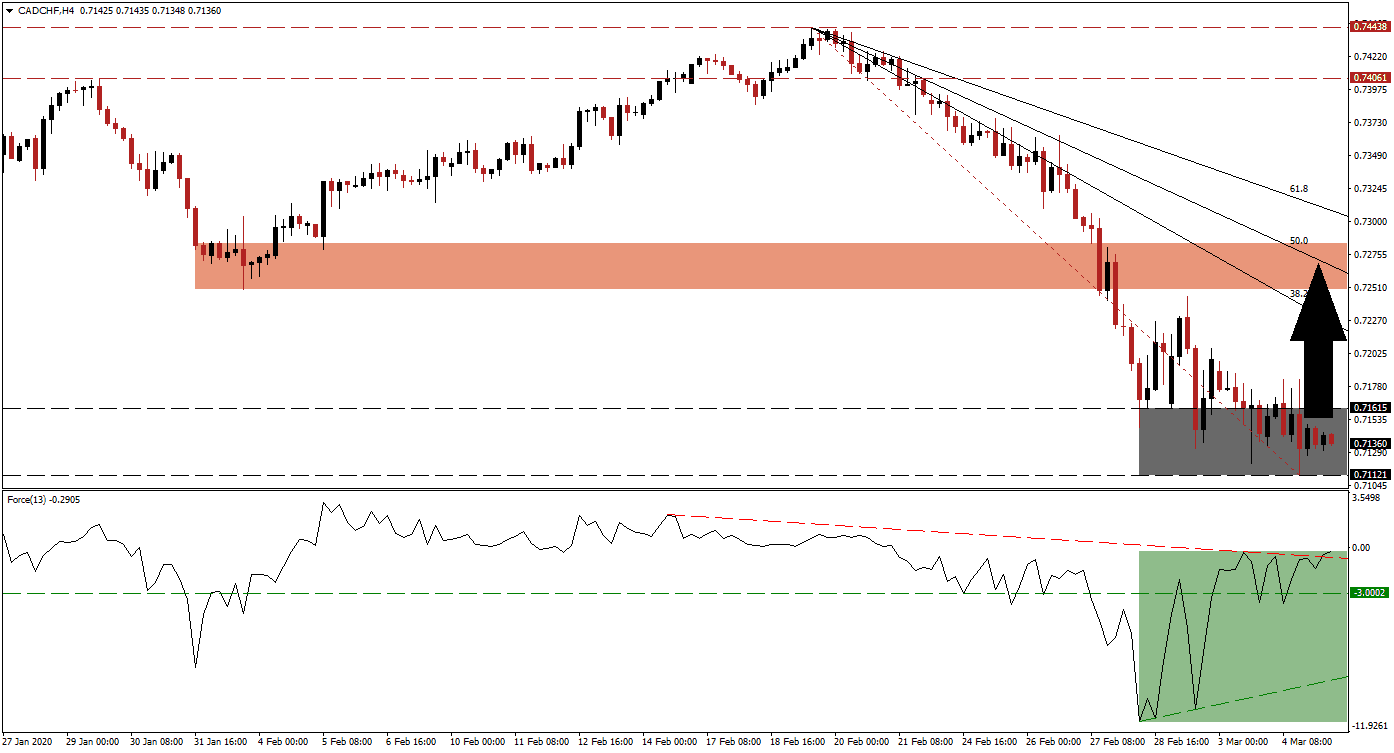
After the Bank of Canada announced an emergency interest rate cut of 50 basis points to 1.25%, mirroring a comparable cut by the US Federal Reserve, the CAD/CHF extended its slide. This currency pair has now stabilized inside of a support zone dating back to April 2017. The rise in bullish momentum indicates the potential for a short-covering rally, which is not expected to violate the long-term bearish chart pattern. Central banks have announced panic cuts Australia, the US, and Canada, with more likely to follow. You can learn more about a short-covering rally here.
The Force Index, a next-generation technical indicator, quickly reversed off a fresh 2020 low, allowing a positive divergence to emerge. Following the conversion of its horizontal resistance level into support, bullish momentum expanded further. The Force Index additionally eclipsed its descending resistance level, as marked by the green rectangle, turning it into temporary support. Bulls are now anticipated to take control of price action in the CAD/CHF once this technical indicator pushes above the 0 center-line.
Given the built-up in bullish pressures, the CAD/CHF is favored to accelerate to the upside, inspired by a breakout above its support zone located between 0.71121 and 0.71615, as marked by the grey rectangle. It will close the gap between this currency pair and its descending 38.2 Fibonacci Retracement Fan Resistance Level. The Swiss National Bank has debated an interest rate cut deeper into negative territory but resorted to direct market manipulation to keep the Swiss Franc depressed. You can learn more about the Fibonacci Retracement Fan here.
Forex traders are advised to monitor the intra-day high of 0.71836, the peak of a failed breakout attempt. A sustained push above this level is expected to result in the addition of new net buy orders, enhancing the pending short-covering rally. It will additionally clear the path for the CAD/CHF to challenge its next short-term resistance zone located between 0.72500 and 0.72840, as marked by the red rectangle. The 50.0 Fibonacci Retracement Fan Resistance Level, currently passing through this zone, will potentially end the advance in this currency pair, enforcing the long-term downtrend.
CAD/CHF Technical Trading Set-Up - Short-Covering Scenario
Long Entry @ 0.71350
Take Profit @ 0.72550
Stop Loss @ 0.70950
Upside Potential: 120 pips
Downside Risk: 40 pips
Risk/Reward Ratio: 3.00
Should the Force Index collapse below its ascending support level, the CAD/CHF is anticipated to attempt a breakdown. Due to the widening disruptions related to Covid-19 on a global economy that was on a weak foundation, safe-haven demand is favored to result in more long-term downside. Price action will face its next support zone between 0.69710 and 0.70050, dating back to August 2015.
CAD/CHF Technical Trading Set-Up - Breakdown Scenario
Short Entry @ 0.70700
Take Profit @ 0.69750
Stop Loss @ 0.71100
Downside Potential: 95 pips
Upside Risk: 35 pips
Risk/Reward Ratio: 2.71

