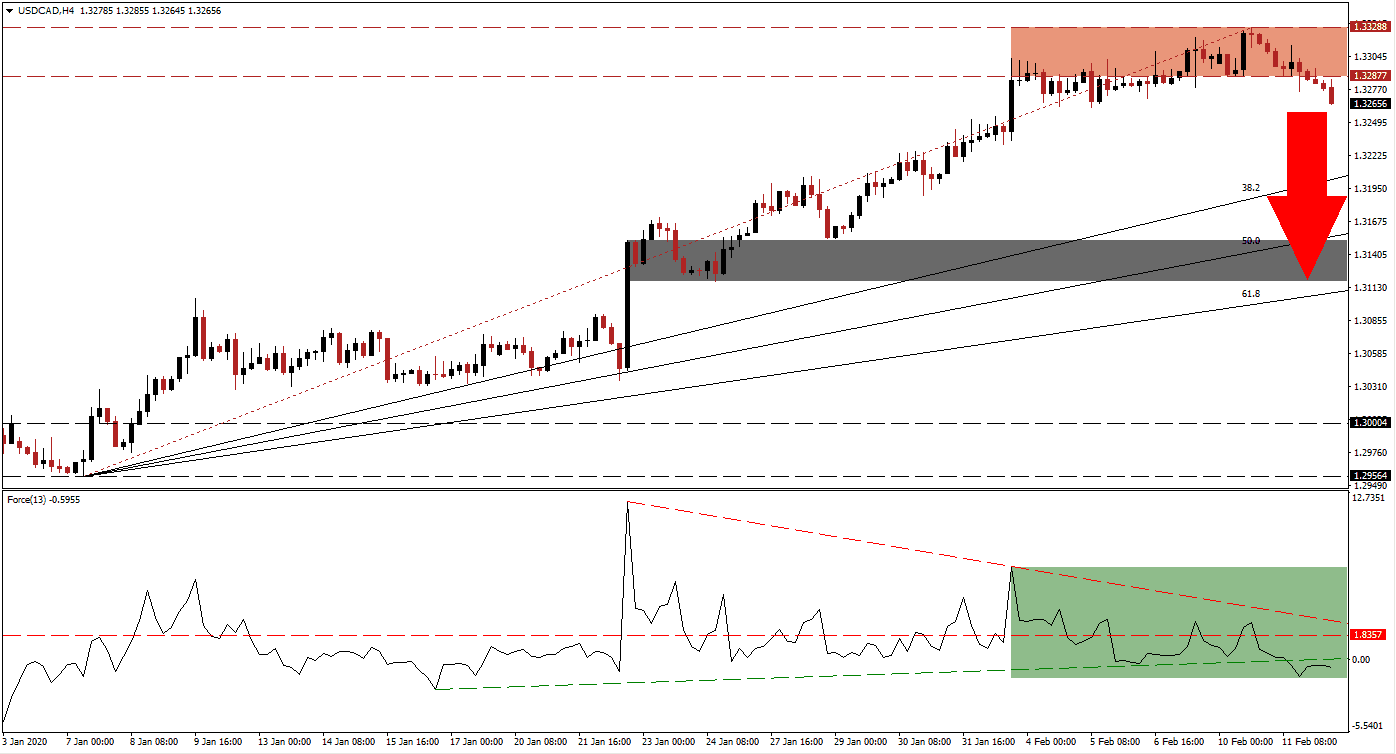
Following the breakdown in this currency pair below its resistance zone, the uptrend in the USD/CAD has ended. Despite a string of upbeat economic reports out of the US and Canada, a second-half recession is on the table. Economists anticipate the US to underperform this year, adding to long-term pressures on the US Dollar. Oil prices have stabilized, as fears of the global economic fallout have eased significantly, providing relief for the Canadian Dollar. More downside is expected to follow the breakdown.
The Force Index, a next-generation technical indicator, provided the first sign that the advance in this currency pair is exhausted. While the USD/CAD extended its advance into its resistance zone, the Force Index contracted sharply. A negative divergence emerged, leading to more bearish developments. The horizontal support level was converted into resistance, as marked by the green rectangle. This technical indicator also slipped below its ascending support level into negative conditions. Bears have taken control of price action, favored to lead a more massive corrective phase.
Price action is now on the verge of igniting a profit-taking sell-off, due to the rise in bearish pressures, after the breakdown below its resistance zone. This zone is located between 1.32877 and 1.33288, as marked by the red rectangle. Adding to bearish developments was the move in the USD/CAD below its Fibonacci Retracement Fan trendline. This currency pair is now positioned to close the gap to its ascending 38.2 Fibonacci Retracement Fan Support Level. You can learn more about a profit-taking sell-off here.
Forex traders are advised to monitor the intra-day low of 1.32346, the low of a candlestick spanning the Fibonacci Retracement Fan trendline, and the resistance zone. A breakdown below this level is likely to trigger net sell-orders, aiding the pending acceleration to the downside. The USD/CAD will face its short-term support zone located between 1.31180 and 1.31518, as marked by the grey rectangle, enforced by its 61.8 Fibonacci Retracement Fan Support Level. More downside is possible, but a fresh fundamental catalyst will be required.
USD/CAD Technical Trading Set-Up - Profit-Taking Scenario
Short Entry @ 1.32650
Take Profit @ 1.31200
Stop Loss @ 1.33100
Downside Potential: 145 pips
Upside Risk: 45 pips
Risk/Reward Ratio: 3.22
In the event of a breakout in the Force Index above its descending resistance level, the USD/CAD is anticipated to attempt a reversal. As a result of the dominant fundamental picture, any upside potential appears limited to its next resistance zone. Before the breakdown, this currency pair was already overextended. The next resistance zone is located between 1.34317 and 1.34688, allowing Forex traders to enter new short positions.
USD/CAD Technical Trading Set-Up - Limited Breakout Scenario
Long Entry @ 1.33400
Take Profit @ 1.34400
Stop Loss @ 1.32900
Upside Potential: 100 pips
Downside Risk: 50 pips
Risk/Reward Ratio: 2.00

