Inflation expectations increased slightly but remained below the Reserve Bank of New Zealand’s annualized target. The focus remains on the economic damages as a result of the coronavirus, where New Zealand is heavily exposed. 87% of service-related exports to China are derived from education-related travel and personal tourism. This has pressured the NZD/USD into its support zone. Signs of stability started to emerge, pointing towards a potential reversal.
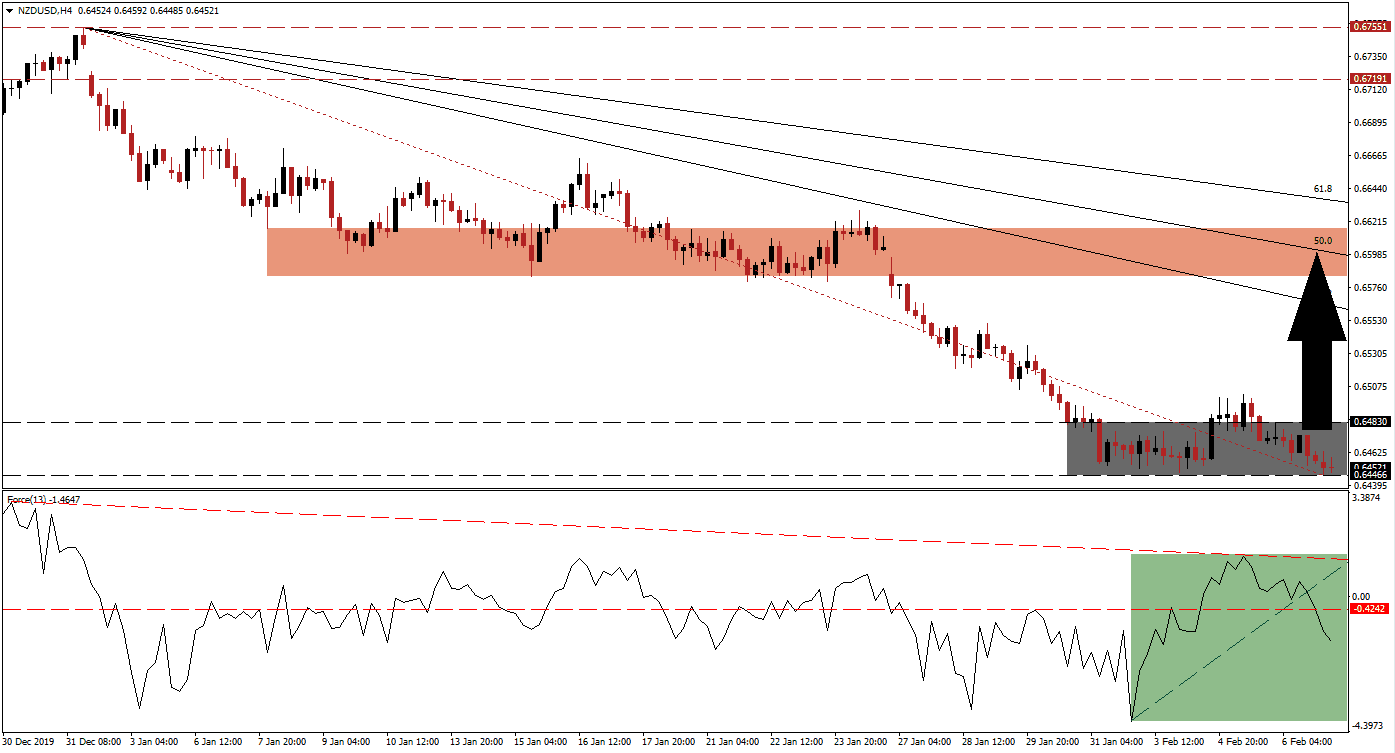
The Force Index, a next-generation technical indicator, accelerated from a lower high into a higher high as price action pushed above its support zone. The Force Index quickly reversed, pressured lower by its descending resistance level. It resulted in a breakdown below its ascending support level, as marked by the green rectangle, and led to a conversion of its horizontal support level into resistance. This technical indicator additionally dipped into negative territory, suggesting bears are in control of the NZD/USD, but it recorded a significantly higher low. The absence of bearish momentum favors a price action reversal.
Adding to bullish developments in this currency pair is the move above its Fibonacci Retracement Fan trendline, inside of its support zone located between 0.64466 and 0.64830, as marked by the grey rectangle. A breakout is likely to trigger a short-covering rally, which will close the gap between the NZD/USD and its descending 38.2 Fibonacci Retracement Fan Resistance Level. Today’s non-farm payroll data out of the US is anticipated to deliver a short-term fundamental catalyst. You can learn more about a short-covering rally here.
One key level to monitor is the intra-day high of 0.65023, the peak of the reversed breakout. A sustained move above this level is expected to attract new net buy positions in the NZD/USD, fueling a counter-trend advance. Price action will face its next short-term resistance zone located between 0.65835 and 0.66165, as marked by the red rectangle. It is enforced by its 50.0 Fibonacci Retracement Fan Resistance Level. An advance into its short-term resistance zone will keep the long-term downtrend intact, and more upside will require a new fundamental catalyst. You can learn more about a breakout here.
NZD/USD Technical Trading Set-Up - Short-Covering Scenario
Long Entry @ 0.64500
Take Profit @ 0.66000
Stop Loss @ 0.64100
Upside Potential: 150 pips
Downside Risk: 40 pips
Risk/Reward Ratio: 3.75
Should the Force Index extend its contraction deeper into negative conditions, pressured to the downside by its descending resistance level, the NZD/USD may attempt a breakdown. While the long-term outlook for the New Zealand Dollar remains bullish, short-term uncertainty due to the coronavirus is in place. A breakdown should take this currency pair into its next support zone, located between 0.63242 and 0.63496, representing an excellent buying opportunity.
NZD/USD Technical Trading Set-Up - Limited Breakdown Scenario
Short Entry @ 0.63900
Take Profit @ 0.63250
Stop Loss @ 0.64200
Downside Potential: 65 pips
Upside Risk: 30 pips
Risk/Reward Ratio: 2.17

