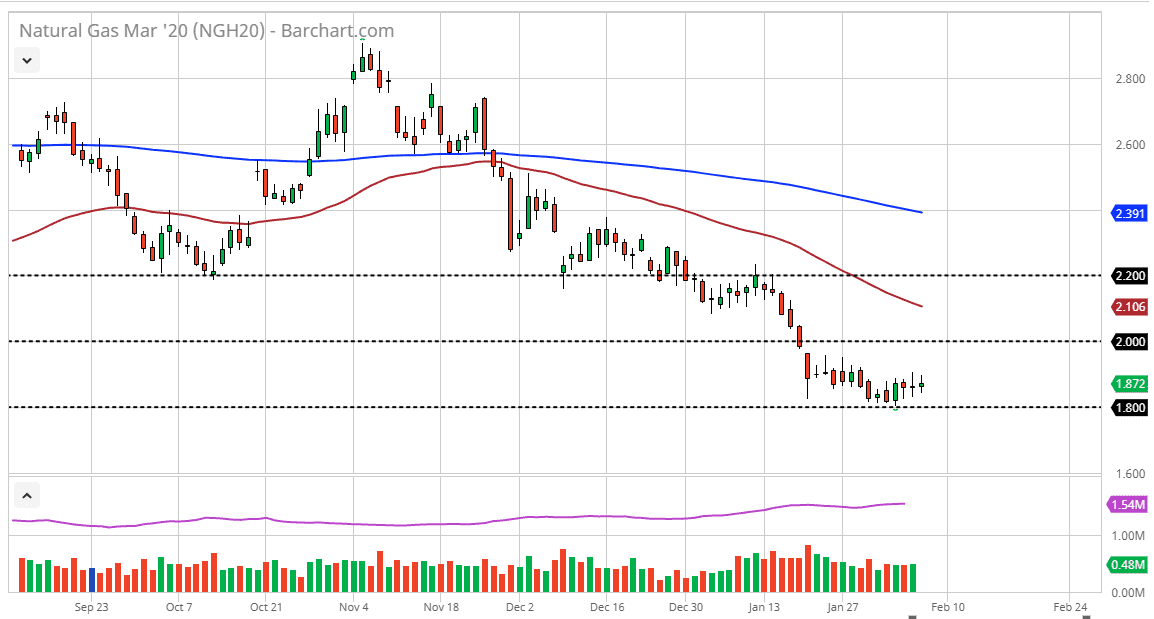
The natural gas markets have tried to form a bit of a base over the last several sessions, showing signs of stabilization, something that this market desperately needs. That being said, I’m not looking to jump in and start buying based upon this, but I do recognize that we could get a bit of a bounce. Temperatures in the United States have fallen a bit but not so much as to wipe out the massive amount of supply. In fact, the supply is probably not going to be threatened anytime soon as the market has seen a huge oversupply of natural gas for a while, and then of course the temperatures through most of the wintertime in the US have been relatively warm.
If the market was to break down below the $1.80 level, then the market will more than likely go looking towards the $1.60 level underneath which is $0.20 lower. That’s the interesting thing about the natural gas markets, they do tend to move in $0.20 increments if you go back historically. Speaking of history, the $1.60 level has been massive support in the past, so it would make sense that the market would be interested in testing that area.
To the upside, the $2.00 level should be obvious resistance just as the 50 day EMA will be $0.10 above there, followed by the $2.20 level. Fundamentally speaking, the natural gas markets are sorely oversupplied, so if we get any type of spike due to weather, that should be looked at through the prism of a selling opportunity, not some reason to go chasing the market. Later this year, we will have a whole slew of bankruptcies in the natural gas sector, as the United States market is oversaturated, and therefore the rest of the world it’s the same. As soon as we get that “creative destruction” that is so necessary, then the markets are likely to rally. Until then, it’s difficult to imagine a scenario where any rally would be sustained. A perfect example would be the Thursday candlestick which had seen a better than anticipated inventory figure, yet the market ended up relatively flat. As I’ve been saying for months now, this is a market that you are looking to sell rallies that show signs of exhaustion or sell breakdowns. Beyond that there isn’t a whole lot more to do in this marketplace.

