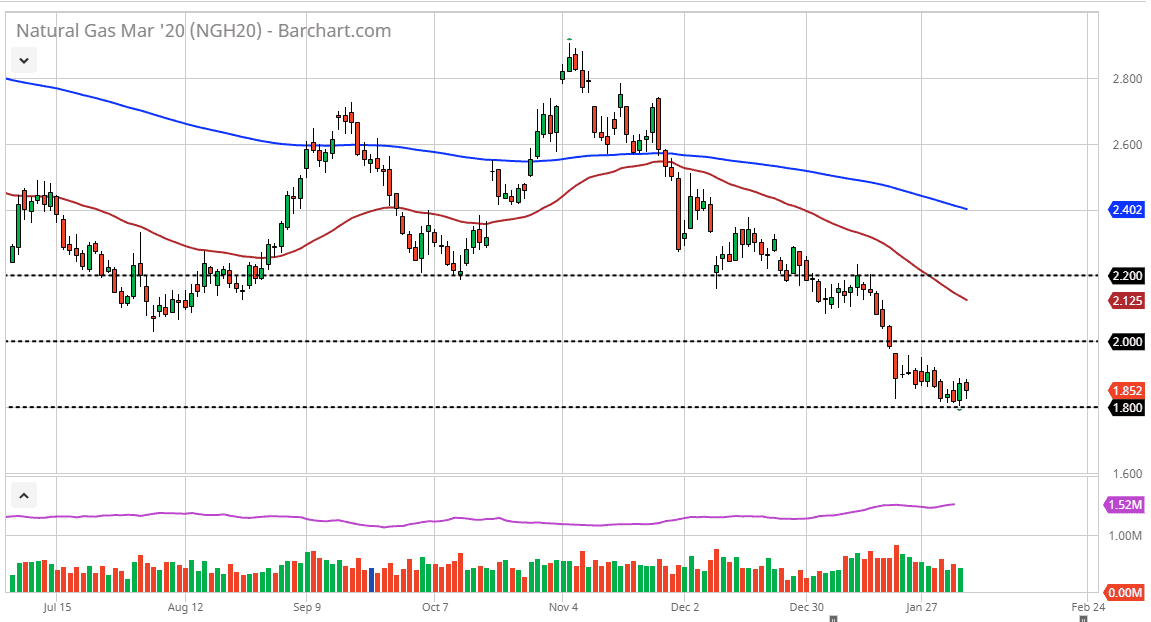
The natural gas markets fell during most of the trading session on Wednesday, reaching towards the $1.80 level yet again, an area that has shown a lot of support recently. Ultimately, the market rallied enough to form a hammer like candle, so it does in fact suggest that perhaps the $1.80 level is trying to act as a buffer to selling. That being said though, the reality is that most traders won’t be able to stomach the type of volatility that this market could bring. However, if we do break out to the upside it’s likely that the market will go looking towards the psychologically round figure of $2.00 above.
Underneath, the market was to break down below the $1.80 level, it’s likely that the market goes looking towards the $1.60 level based upon the fact that we have seen a massive bounce from that level on longer-term charts, and the fact that the market does tend to move in $0.20 increments overall. The reaction of buyers coming back into the market is of course a significant turn of events, considering that it was preceded by a very bullish candlestick. It is because of this that I would not be spreads at all to see some type of relief rally, but as far as a longer-term recovery is concerned, it’s very difficult to imagine a scenario where that happens as long as we have so much in the way of overall overhang in supply and a serious lack of cold temperatures in the United States. As long as that’s the case, natural gas markets will continue to suffer.
However, down the road we are likely to see a lot of bankruptcies as we are already starting to see the fallout from extraordinarily low pricing on US suppliers and drillers, and once those wave of bankruptcies get done, the markets are more than likely going to start to see supply dwindle, perhaps driving price higher. That is a longer-term fundamental situation, so it’s not something that you can trade on right now. Rallies at this point are to be faded as soon as they show signs of weakness, with the $2.00 level being the first area that I would look, followed by the 50 day EMA which is painted in red on the chart and currently hanging near the $2.12 level above.

