With the coronavirus expanding, the economic damages have not started to simmer through. China is at the core of the supply chain, with ripple effects likely to last longer than analysts currently account for. Over 17,205 cases were confirmed as the death toll rose to 361, both figures are constantly revised higher. The risk-off sentiment is expected to dominate, favoring a new breakout sequence in gold above its psychological $1,600 resistance level. Experts warn that the coronavirus is taking the shape of an epidemic. You can learn more about a breakout here.
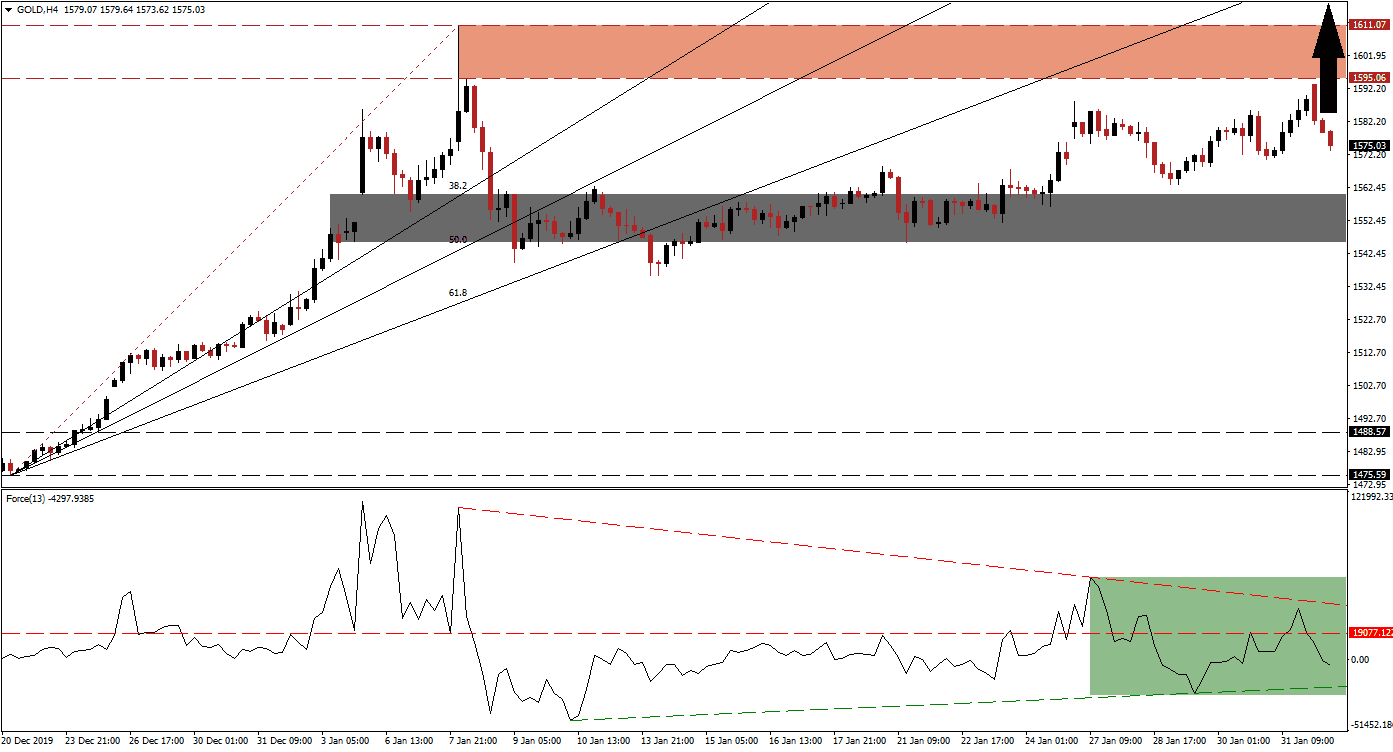
The Force Index, a next-generation technical indicator, retreated from a lower high while converting its horizontal support level into resistance. Its descending resistance level is adding to downside pressures. After the Force Index crossed below the 0 center-line, its ascending support level is cushioning the contraction, as marked by the green rectangle. Bears have taken control of price action, but due to the rising threat posed by the spreading coronavirus, a momentum recovery is anticipated to precede a recovery in gold.
Volatility will remain elevated as the situation unfolds and increases in size. Since the last temporary breakdown in this precious metal below its short-term support zone located between 1,545.95 and 1,620.20, as marked by the grey rectangle, a dominant bullish chart pattern emerged. A series of higher highs and higher lows provide the proper conditions for a new breakout sequence in gold, keeping the advance intact. You can learn more about a support zone here.
Due to the sideways trend, following the push in gold below its entire Fibonacci Retracement Fan sequence, the upside after a sustained breakout above its resistance zone is enhanced. Price action will face this resistance zone between 1,595.06 and 1,611.07, as marked by the red rectangle. This critical zone includes a multi-year high, and a breakout will clear the path for a massive extension of the rally. The next resistance zone awaits this precious metal between 1,672.22 and 1,696.41, dating back to January 2013.
Gold Technical Trading Set-Up - Breakout Extension Scenario
Long Entry @ 1,575.00
Take Profit @ 1,695.00
Stop Loss @ 1,540.00
Upside Potential: 12,000 pips
Downside Risk: 3,500 pips
Risk/Reward Ratio: 3.43
Should the Force Index push below its ascending support level, gold is favored to attempt a breakdown below its short-term support zone. Given the long-term bullish fundamental outlook for this precious metal, any contraction is likely to remain limited to its intra-day low of 1,502.50. It formed after a price gap to the upside, following a breakout above its support zone located between 1,475.59 and 1,488.57. A breakdown will require a major fundamental catalyst, and traders are advised to consider any sell-off as an excellent buying opportunity.
Gold Technical Trading Set-Up - Limited Breakdown Scenario
Short Entry @ 1,530.00
Take Profit @ 1,505.00
Stop Loss @ 1,540.00
Downside Potential: 2,500 pips
Upside Risk: 1,000 pips
Risk/Reward Ratio: 2.50

