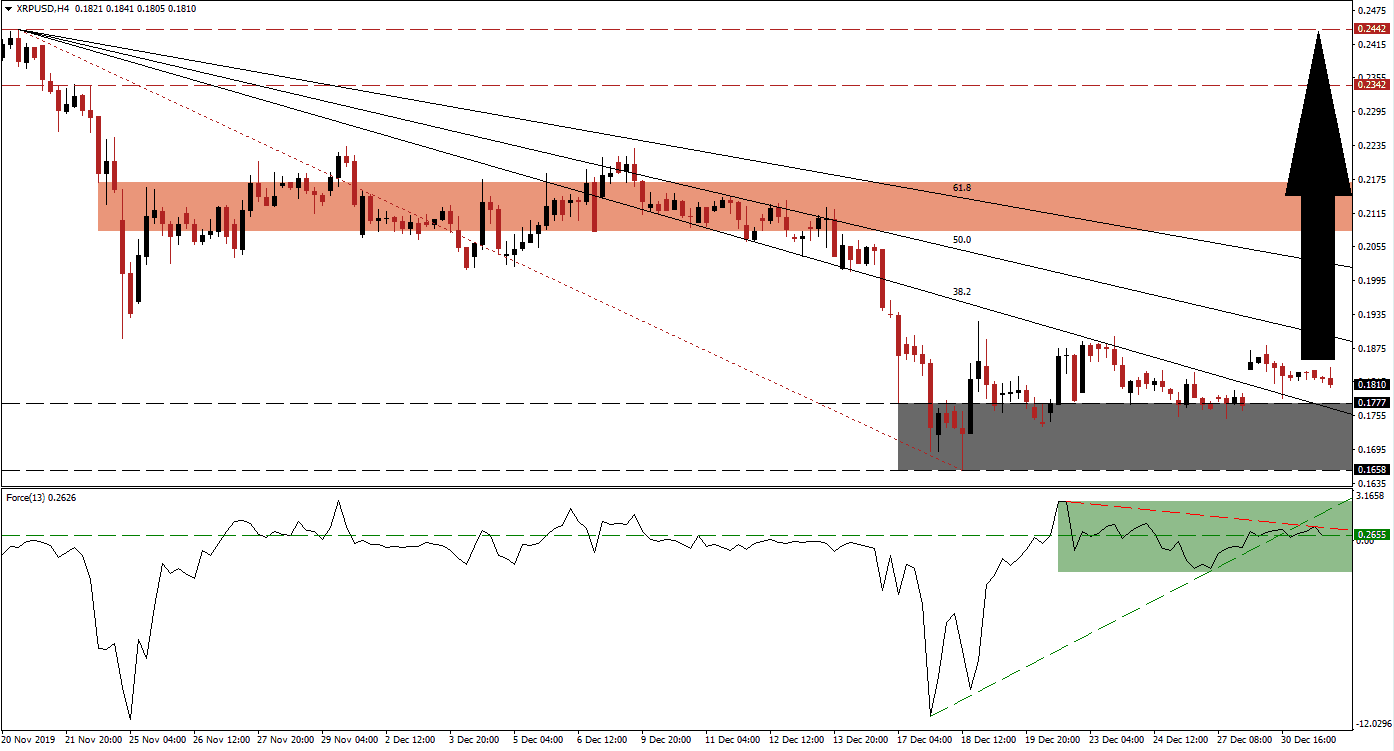
Ripple, or more precisely the Ripple token, joined Ethereum in a disastrous 2019 from a price action perspective. Unlike Ethereum, Ripple has outstanding fundamentals that are favored to initiate a price action recovery throughout 2020. The Ripple Foundation just secured a $200 C-Round of financing, giving it a valuation of $10 billion, but many token holders remain frustrated about the price. Some have accused the foundation of dumping tokens, claims which are denied by Ripple. The XRP/USD started to drift higher after recording a 2019 low just two weeks ago and pushed out of its support zone.
The Force Index, a next-generation technical indicator, recovered from a steep plunge as price action reached its support zone. It managed to record a higher low, and an ascending support level emerged. The Force Index accelerated to the upside and converted its horizontal resistance level into support, as marked by the green rectangle. A minor sideways trend materialized, and this technical indicator moved below its ascending support level, while its descending resistance level is adding bearish pressures. A double breakout is expected to elevate the Force Index and led the XRP/USD into a breakout sequence.
After this cryptocurrency pair eclipsed its support zone located between 0.1658 and 0.1777, as marked by the grey rectangle, price action stalled as portfolio managers closed the books for 2019. A price gap to the upside took the XRP/USD above its descending 38.2 Fibonacci Retracement Fan Resistance Level, turning it into support. Traders are advised to monitor the intra-day high of 0.1879, the peak of the current breakout. More net long positions are expected after price action moves above this level. A short-covering rally is anticipated to follow.
Unless this cryptocurrency pair maintains a breakout above its 50.0 Fibonacci Retracement Fan Resistance Level, bearish pressures will remain dominant. The current price of the Ripple token does not reflect fundamental reality, and 2020 is favored to correct the disconnect. From a percentage perspective, the XRP/USD possesses the best most attractive upside potential among established cryptocurrencies. The next major resistance level awaits price action at its short-term resistance zone located between 0.2082 and 0.2169, as marked by the red rectangle. A breakout is likely to extend the advance into its next long-term resistance zone between 0.2342 and 0.2442. You can learn more about a breakout here.
XRP/USD Technical Trading Set-Up - Breakout Extension Scenario
Long Entry @ 0.1800
Take Profit @ 0.2440
Stop Loss @ 0.1600
Upside Potential: 640 pips
Downside Risk: 200 pips
Risk/Reward Ratio: 3.20
Should the Force Index be pressured into negative territory by its descending resistance level, the XRP/USD may attempt a breakdown. The dominant bullish fundamental environment limits the downside potential to its next support zone located between 0.1270 and 0.1481, which would offer traders an outstanding buying opportunity. A breakdown into this support zone is extremely unlikely, but cannot be ruled out as a result of a volatile trading environment.
XRP/USD Technical Trading Set-Up - Unlikely Breakdown Scenario
Short Entry @ 0.1550
Take Profit @ 0.1350
Stop Loss @ 0.1650
Downside Potential: 200 pips
Upside Risk: 100 pips
Risk/Reward Ratio: 2.00

